
April 16, 2025
US Equity Strategy
Dividend Growth
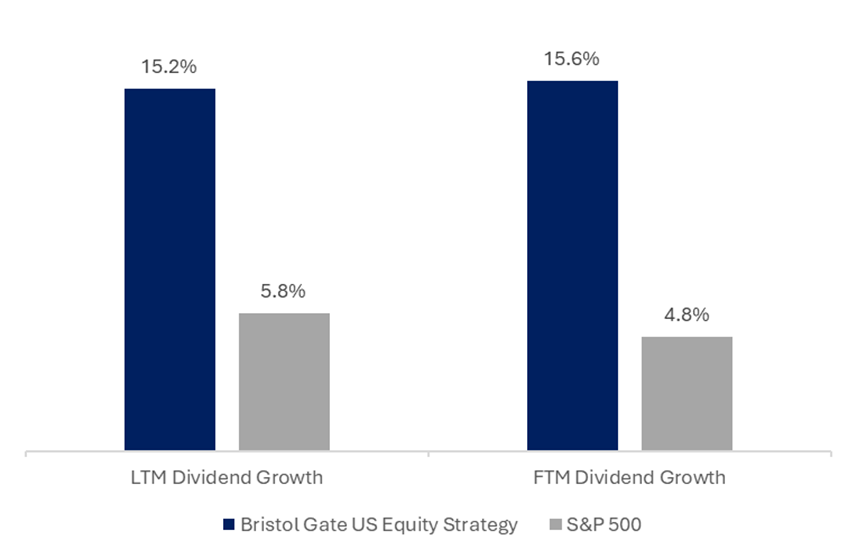
Note: LTM Dividend Growth is the median of the actual trailing 12-month dividend growth of the individual stocks held by Strategy or Index constituents as reported by Bloomberg on March 31, 2025. FTM Dividend Growth is the median of the Bristol Gate Model’s forward 12-month prediction for the individual stocks held by the Strategy and the median of consensus estimates for the constituents of the Index as of March 31, 2025. Companies without a consensus dividend forecast were excluded, as were dividend initiators due to a lack of prior year comparable.
Source: Bloomberg, FactSet, Bristol Gate Capital Partners.
Portfolio Results
The Bristol Gate U.S. Equity Strategy outperformed the S&P 500 Total Return Index during a volatile Q1. The quarter began with optimism driven by the inauguration of Donald Trump and an anticipated pro-business agenda, including tax cuts and deregulation, driving the Index above 6,100 by late January. However, February and March saw sharp declines in the market amid concerns about economic growth, inflation, and tariff-related uncertainties. The administration’s inconsistent tariff policies significantly increased market uncertainty, negatively impacting business confidence as well as consumer and investor sentiment.
Key Contributors
Sector allocation and stock selection aided the strategy’s outperformance in Q1. Leading contributors included GE Aerospace, McKesson, and Marsh & McLennan. The portfolio’s underweight to the “Magnificent Seven” benefitted the strategy during the quarter. While these companies drove market performance in 2024, their average decline of 16% this quarter led to outsized declines in the market.
Key Detractors
The traditional defensive sectors—Consumer Staples, Energy, Real Estate, and Utilities— performed well and detracted from our relative performance during the quarter. These sectors offer higher dividend yields but lower dividend growth potential, aligning less closely with our strategy of prioritizing companies capable of sustained high dividend growth. During periods of economic uncertainty or heightened recessionary risks, investors often shift towards sectors offering higher yields and lower volatility rather than future dividend increases.
Broadcom, Microchip, and Applied Materials were amongst the leading laggards. Broadcom and Applied Materials were impacted by souring investor sentiment around the AI theme. We still believe Broadcom and Applied Materials are extremely well positioned to take advantage of durable long-term trends. Microchip continues to navigate a difficult demand environment following broad inventory adjustments across its customer base. The company held an Investor Day in early March where management provided a detailed nine-point restructuring plan, implementing change across the company. Microchip’s realized savings from these actions should total ~$140M. Furthermore, management cited improved bookings and a stabilized backlog, potentially indicating the bottom of the inventory correction, albeit that was prior to the tariff announcements discussed below.
Portfolio Transactions
During the quarter, we initiated positions in Eli Lilly and Co. (LLY), Westinghouse Air Brake Technologies Corp. (WAB), and Domino’s Pizza Inc. (DPZ). These purchases were primarily funded by exiting CSX Corp. (CSX), Corteva Inc. (CTVA), and Lowe’s Companies Inc. (LOW). The rationale for exiting the names was primarily driven by reduced dividend growth expectations.
Eli Lilly was added after a pullback, providing an attractive entry point. We’re encouraged and anticipate sustained revenue and earnings growth driven by its leading diabetes and obesity treatments, especially given increasing insurance coverage due to therapeutic validation in related comorbidities for its GLP-1 drugs. We expect ongoing dividend growth at a robust mid-teens rate or higher.
Westinghouse Air Brake Technologies is a global market leader in freight and passenger rail technologies, which benefits from a significant installed base that generates stable, recurring revenue. Its expanding international presence and its exposure to the domestic locomotive fleet’s upgrade cycle offer compelling growth opportunities. WAB also maintains a solid track record of consistent dividend increases and announced an additional 25% dividend increase in February.
Domino’s Pizza, the largest pizza company in the world, operates an asset-light, highly franchised model (99% franchised), generating strong free cash flow and high return on capital. The company consistently gains market share within the fragmented U.S. pizza industry, driven by superior unit economics, technology leadership, incremental aggregator partnerships (e.g., Uber Eats, DoorDash), and a powerful brand that appeals to value-conscious consumers. Domino’s substantial international growth opportunity, particularly in China and India, provides significant long-term upside. Plans for store expansion include targeting 18,500 international stores by 2028 (versus approximately 14,400 currently) and ultimately 40,000 units globally.
During the quarter, we trimmed positions in Broadcom, MSCI, Moody’s, Mastercard, and GE Aerospace, reallocating capital toward the new positions, along with increasing our weighs in Applied Materials and Microchip, as part of our portfolio rebalancing process.
Outlook
90% of our holdings beat consensus earnings estimates, delivering median EPS growth of 12% (14% average) during the most recent earnings season. Bristol Gate remains confident in our portfolio’s fundamental strength.
We are continually monitoring the potential tariff impacts on our portfolio and remain diligent in our review. In our view, the portfolio has limited direct tariff exposure. Half of the portfolio consists of service-oriented businesses, largely insulated from tariff impacts. The remaining names have proactively developed strategies such as supply chain adjustments and pricing initiatives to mitigate potential risks.
Our concern lies in the indirect risks posed by tariffs, specifically the potential for these policies to spark broader economic instability or a recession. The economic consequences of President Trump’s “Liberation Day” tariffs have been swift and significant. The policy marks the most expansive and disruptive tariff implementation since the Smoot-Hawley Tariff Act of 1930. The Trump tariffs, initially a universal 10% tariff on all imported goods with subsequent higher rates targeting specific nations, quickly led to escalations with various trade partners, highlighted by China’s perceived defiance and lack of cooperation to negotiate. Market reaction was severe: the S&P 500 dropped 10.5% over two trading sessions from April 3rd to April 4th, marking the largest two-day decline since the depths of the Global Financial Crisis as investors rapidly priced in fears of retaliatory tariffs, rising costs for both businesses and consumers, weakening demand, and declining corporate profitability.
Market events of this magnitude erode investor confidence, prompting investors to make impulsive decisions, such as exiting the market, often to their detriment. While the probability of a global recession has increased, we caution investors against adopting an overly defensive posture for several compelling reasons:
- the administration’s seemingly unpredictable tariff policies might yield positive engagement
- the initial broad-based tariffs could be a strategic “shock and awe” tactic intended to strengthen negotiating leverage and potentially paving the way toward more balanced, long-term trade policies
- the portfolio is exceptionally well-equipped to navigate, and even benefit from challenging economic environments. Our holdings include industry-leading firms characterized by solid market positions, strong balance sheets, consistent generation of substantial free cash flows, and proven resilience through past economic downturns
- these companies are strategically positioned not only to endure economic stresses but to leverage market downturns by acquiring weaker competitors or making strategic self funded investments, enhancing their long-term market strength
These businesses have consistently demonstrated a commitment to growing dividends. Eight of our holdings announced dividend increases in Q1/25 averaging approximately 15%. Given the portfolio companies’ robust financial health, we anticipate continually increasing dividend payouts, providing our investors with reliable and growing income streams, even amid market turbulence.
We will look to take advantage of the volatility and upgrade the portfolio where opportunities arise. Inevitably volatility spikes are often excellent opportunities to deploy or reposition capital to build long term wealth.
In summary, despite the current unknowns, we firmly believe our thoughtfully constructed portfolio offers an attractive investment opportunity. Our strategic selection of resilient, market-leading companies positions us to manage risks effectively while continuing to generate strong returns for our investors with the utmost confidence. Strategies that pursued broader diversification, such as the S&P 500 Equal Weight Index, also underperformed the S&P 500 Index (weighted by market capitalization). The Equal Weight Index was up by approximately 13% in 2024.
Source: Bristol Gate Capital Partners. There is a risk of loss inherent in any investment; past performance is not indicative of future results. Please see important disclosures at end of document.
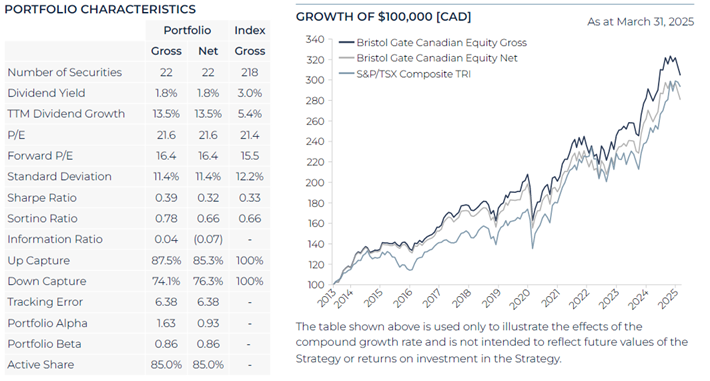
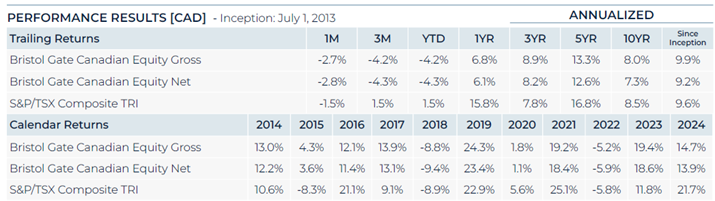
Canadian Equity Strategy
Dividend Growth
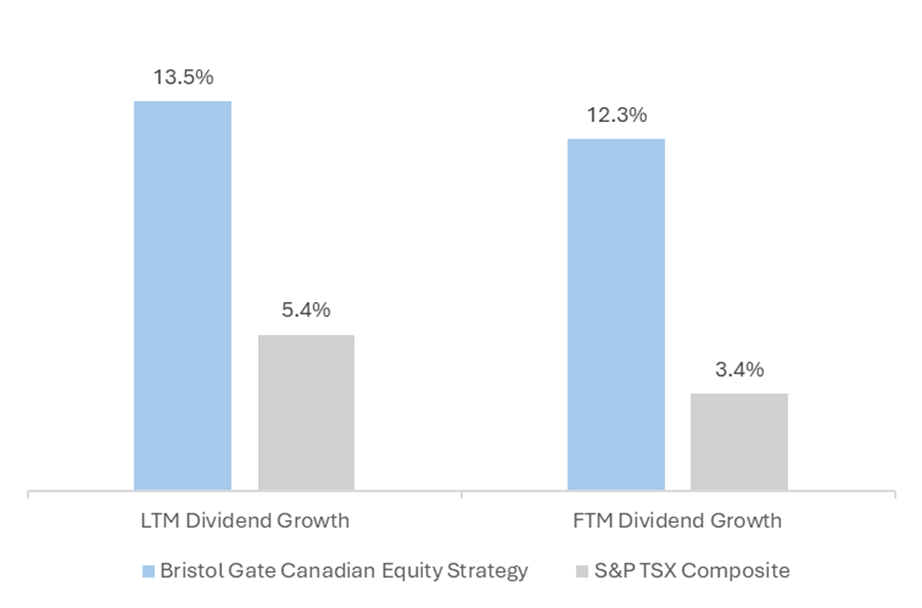
Note: LTM Dividend Growth is the median of the actual trailing 12-month dividend growth of the individual stocks held by Strategy or Index constituents as reported by Bloomberg on March 31, 2025. FTM Dividend Growth is the median of the Bristol Gate Model’s forward 12-month prediction for the individual stocks held by the Strategy and the median of consensus estimates for the constituents of the Index as of March 31, 2025. Companies without a consensus dividend forecast were excluded, as were dividend initiators due to a lack of prior year comparable.
Source: Bloomberg, FactSet, Bristol Gate Capital Partners.
Portfolio Results
The Bristol Gate Canadian Equity Strategy underperformed the S&P/TSX Composite Index in Q1. Markets started the year strong, however, February and March saw increased volatility amid growing concerns about economic growth, inflation, and tariff-related uncertainties. Despite the volatility, the Index ended the quarter in positive territory led by Materials (gold companies) delivering an outsized 20.3% return (over 1500 basis points higher than the next closest sector. Utilities and Energy rounded out the top 3 sectors in Q1.
Key Contributors
Stock selection within Financials, TMX Group and Intact Financial were the leading contributor in Q1. Intact delivered strong quarterly results that beat analyst expectations driven by lower than expected catastrophe losses and stronger than expected underwriting results. Intact raised its dividend by 10%, marking the 20th consecutive annual dividend increase.
TMX Group began February on a strong note, after posting better than expected quarterly results that continued through the rest of the period. Management successfully diversified roughly half of the company’s revenue sources with subscription-based value-add services and the balance in the traditional trading and capital formation related businesses. investors received the news positively, as TMX Group closed its valuation gap relative to international exchange peers. Of note, the company also raised its dividend by 5%.
Stock selection in Consumer Discretionary, led by Dollarama was also a positive contributor. Towards the end of Q1, the company announced the acquisition of the leading Australia discount retailer, The Reject Shop, adding another growth lever.
Key Detractors
A portfolio underweight to Materials (gold companies), negatively impacted relative returns in the quarter as gold prices rose close to 20%. Traditionally, the mining sector has not produced consistent dividend growers and disciplined capital allocators, resulting in a meaningful underweight.
On an absolute basis, TFI International, Broadcom and Jamieson Wellness were our leading laggards in Q1.
TFI International declined significantly after reporting disappointing quarterly results in February. Subdued freight volumes combined with market share losses, specifically in the US, where larger competitors used their scale and cost advantage in a challenging environment, hurt results. While the results are a disappointing start for a new holding, we have faith in management both as operators and capital allocators. Bristol Gate expects management to address and improve efficiencies in the performance of its US business over time.
Broadcom was impacted by souring sentiment around the AI theme. We believe the company is extremely well positioned to take advantage of durable long-term trends.
Jamieson Wellness underperformed despite demonstrating continued strong international growth and Canadian market leadership as reflected in solid quarterly results. Late Q1, the company hosted an investor event where it highlighted various opportunities, including continuing to grow profitably in the US and China. Bristol Gate believes the market does not fully appreciate these long-term opportunities.
Portfolio Transactions
In Q1, we trimmed Broadcom and reinvested the proceeds into Stella Jones and Premium Brands as part of our regular quarterly rebalancing process.
Outlook
We remain confident in the portfolio’s fundamental strength. Approximately 70% of our holdings surpassed revenue and earnings expectations, achieving median growth rates of 6.5% and 13.0%, respectively.
We are continually monitoring the potential tariff impacts on our portfolio and remain diligent in our review. In our view, the portfolio has modest direct tariff exposure. Many of our holdings attribute a large portion of their revenues to the US, but they also maintain production capacity within the US, helping mitigate tariff implications. The remaining holdings have proactively developed strategies such as supply chain adjustments and pricing initiatives to mitigate risks and potential exposure. Like our US Strategy, the primary risk remains indirect—potential tariffs triggering broader economic stress or a recession.
Our companies remain well-positioned due to market leadership, robust balance sheets, strong cash flows, and a proven track record. We expect our companies to leverage economic downturns through strategic investments and acquisitions, supporting sustained dividend growth averaging 11.2% year-to-date. Overall, the portfolio continues to represent an attractive opportunity in an uncertain market.
Source: Bristol Gate Capital Partners. There is a risk of loss inherent in any investment; past performance is not indicative of future results. Please see important disclosures at end of document.
Firm Update
To all our clients, thank you for your ongoing support and trust. We are determined to do everything we can to provide you income growth and strong investment returns in the future.
Sincerely,
The Bristol Gate Team
Important disclosures
There is a risk of loss inherent in any investment; past performance is not indicative of future results. Prospective and existing investors in Bristol Gate’s pooled funds or ETF funds should refer to the fund’s offering documents which outline the risk factors associated with a decision to invest. Separately managed account clients should refer to disclosure documents provided which outline risks of investing. Pursuant to SEC regulations, a description of risks associated with Bristol Gate’s strategies is also contained in Bristol Gate’s Form ADV Part 2A located at www.bristolgate.com/regulatory-documents.
The information contained herein is obtained from multiple sources that are believed to be reliable. However, such information may not have been verified, and may be different from the information included in documents and materials created by a sponsor firm in whose investment program a client participates. Some sponsor firms may require that these Bristol Gate materials are preceded or accompanied by investment profiles or other documents or materials prepared by such sponsor firms, which will be provided upon a client’s request. There may be discrepancies between Bristol Gate’s performance returns and the returns included in a sponsor firm’s profile document (for example, but not limited to, differences in account size/type, portfolio management strategies, the number of securities held, average account size, inclusion of institutional or mutual fund accounts, etc.) For additional information, documents and/or materials, please speak to your Financial Advisor.
US Equity Strategy returns in this report refer to the Bristol Gate US Equity Strategy Composite (the “US Composite”). The US Composite consists of equities of publicly traded, dividend paying US companies. The US Composite is valued in US Dollars and for comparison purposes is measured against the S&P 500 Total Return Index. The US Composite’s Investment Advisor, Bristol Gate Capital Partners Inc., defines itself as a portfolio manager, exempt market dealer and investment fund manager (as per its registration in Ontario, its principal regulator in Canada) and is also a Registered Investment Adviser with the U.S. Securities and Exchange Commission (the “SEC”). The Investment Advisor’s objective is to select companies with positive dividend growth, and which collectively will generate over the long term a growing income and capital appreciation for investors. The inception date of the US Composite is May 15, 2009. The US Dollar is the currency used to measure performance, which is presented on a gross and net basis and includes the reinvestment of investment income. The US Composite’s gross return is gross of withholding tax prior to January 1, 2017 and is net of withholding tax thereafter. Net returns are calculated by reducing the gross returns by the maximum management fee charged by Bristol Gate of 1%, applied monthly. Actual investment advisory fees incurred by clients may vary. There is the opportunity for the use of leverage up to 30% of the net asset value of the underlying investments using a margin account at the prime broker. Thus far no material leverage has been utilized. An investor’s actual returns may be reduced by management fees, performance fees, and other operating expenses that may be incurred because of the management of the US Composite. A performance fee may also be charged on some accounts and funds managed by the firm. Bristol Gate claims compliance with the Global Investment Performance Standards (GIPS®). GIPS® is a registered trademark of CFA Institute. CFA Institute does not endorse or promote this organization, nor does it warrant the accuracy or quality of the content contained herein. To obtain a GIPS Composite Report, please email us at info@bristolgate.com.
The S&P 500® Total Return Index measures the performance of the broad US equity market, including dividend re-investment, in US dollars. This index is provided for information only and comparisons to the index has limitations. The benchmark is an appropriate standard against which the performance of the strategy can be measured over longer time periods as it represents the primary investment universe from which Bristol Gate selects securities. However, Bristol Gate’s portfolio construction process differs materially from that of the benchmark and the securities selected for inclusion in the strategy are not influenced by the composition of the benchmark. For example, the strategy is a concentrated portfolio of approximately equally weighted dividend-paying equity securities, rebalanced quarterly whereas the benchmark is a broad stock index (including both dividend and non-dividend paying equities) that is market capitalization weighted. As such, strategy performance deviations relative to the benchmark may be significant, particularly over shorter time periods. The strategy has concentrated investments in a limited number of companies; as a result, a change in one security’s value may have a more significant effect on the strategy’s value.
In addition to the US Equity strategy’s benchmark described above, the following additional Index data may be presented for information purposes only and comparisons to this index has limitations:
S&P 500 ® Total Return Dividend Aristocrats Index measures the performance of a subset of S&P 500® Index companies that have increased their dividends every year for the last 25 consecutive years. This Index focuses on historical dividend growth, whereas Bristol Gate’s US Equity strategy’s securities are selected based on future dividend growth.
SPDR® S&P 500® ETF Trust (SPY US) sourced from Bloomberg has been used as a proxy for the S&P 500® Total Return Index for the purpose of providing non-return-based portfolio statistics and sector weightings in this report. SPY US is an ETF that seeks to provide investment results that, before expenses, correspond generally to the price and yield performance of the S&P 500® Index.
Canadian Equity Strategy returns in this report refer to the Bristol Gate Canadian Equity Strategy Composite (the “Canadian Composite”). The Canadian Composite consists primarily of equities of publicly traded, dividend paying Canadian companies. The Canadian Composite is valued in Canadian Dollars and for comparison purposes is measured against the S&P/TSX. The Canadian Composite’s Investment Advisor, Bristol Gate Capital Partners Inc., defines itself as a portfolio manager, exempt market dealer and investment fund manager (as per its registration in Ontario, its principal regulator in Canada) and is also a Registered Investment Adviser with the U.S. Securities and Exchange Commission (the “SEC”). The Investment Advisor’s objective is to select companies primarily from the S&P/TSX universe with positive dividend growth and which collectively will generate over the long term a growing income and capital appreciation for investors. The inception date of the Canadian Composite is July 1, 2013. Returns are presented gross and net of fees and include the reinvestment of all income. The Canadian composite’s gross return is gross of withholding tax prior to January 1, 2017 and is net of withholding tax thereafter. Net returns are calculated by reducing the gross returns by the maximum management fee charged by Bristol Gate of 0.7%, applied monthly. Actual investment advisory fees incurred by clients may vary. An investor’s actual returns may be reduced by management fees, performance fees, and other operating expenses that may be incurred because of the management of the Canadian Composite. A performance fee may be charged on some accounts and funds managed by the firm. Bristol Gate claims compliance with the Global Investment Performance Standards (GIPS®). GIPS® is a registered trademark of CFA Institute. CFA Institute does not endorse or promote this organization, nor does it warrant the accuracy or quality of the content contained herein. To obtain a GIPS Composite Report, please email us at info@bristolgate.com.
The returns have been converted into Canadian Dollars using the prevailing Canadian/United States dollar exchange rate.
The S&P/TSX Total Return Index measures the performance of the broad Canadian equity market, including dividend re-investment, in Canadian dollars. This index has been provided for information only and comparisons to the index has limitations. The benchmark is an appropriate standard against which the performance of the strategy can be measured over longer time periods as it represents the primary investment universe from which Bristol Gate selects securities. However, Bristol Gate’s portfolio construction process differs materially from that of the benchmark and the securities selected for inclusion in the strategy are not influenced by the composition of the benchmark. For example, the strategy is a concentrated portfolio of approximately equally weighted dividend-paying equity securities, rebalanced quarterly whereas the benchmark is a broad stock index (including both dividend and non-dividend paying equities) that is market capitalization weighted. As such, strategy performance deviations relative to the benchmark may be significant, particularly over shorter time periods. The strategy has concentrated investments in a limited number of companies; as a result, a change in one security’s value may have a more significant effect on the strategy’s value.
iShares Core S&P®/TSX® Capped Composite Index ETF (XIC CN) sourced from Bloomberg has been used as a proxy for the S&P®/TSX® Total Return Index for the purpose of providing non-return-based portfolio statistics and sector weightings in this report. XIC CN is an ETF that seeks long-term capital growth by replicating the performance of the S&P®/TSX® Capped Composite Index, net of expenses.
This Report is for information purposes and should not be construed under any circumstances as a public offering of securities in any jurisdiction in which an offer or solicitation is not authorized. Prospective investors in Bristol Gate’s pooled funds or ETF funds should rely solely on the fund’s offering documents, which outline the risk factors associated with a decision to invest. No representations or warranties of any kind are intended or should be inferred with respect to the economic return or the tax implications of any investment in a Bristol Gate fund.
This piece is presented for illustrative and discussion purposes only. It should not be considered as personal investment advice or an offer or solicitation to buy and/or sell securities and it does not consider unique objectives, constraints, or financial needs of the individual. Under no circumstances does this piece suggest that you should time the market in any way or make investment decisions based on the content. Investors are advised that their investments are not guaranteed, their values change frequently, and past performance may not be repeated. References to specific securities are presented to illustrate the application of our investment philosophy only, do not represent all of the securities purchased, sold or recommended for the portfolio, and it should not be assumed that investments in the securities identified were or will be profitable and should not be considered recommendations by Bristol Gate Capital Partners Inc. A full list of security holdings is available upon request. For more information contact Bristol Gate Capital Partners Inc. directly. The information contained in this piece is the opinion of Bristol Gate Capital Partners Inc. and/or its employees as of the date of the piece and is subject to change without notice. Every effort has been made to ensure accuracy in this piece at the time of publication; however, accuracy cannot be guaranteed. Market conditions may change and Bristol Gate Capital Partners Inc. accepts no responsibility for individual investment decisions arising from the use of or reliance on the information contained herein. We strongly recommend you consult with a financial advisor prior to making any investment decisions. Please refer to the Legal section of Bristol Gate’s website for additional information at bristolgate.com.
A Note About Forward-Looking Statements
This report may contain forward-looking statements including, but not limited to, statements about the Bristol Gate strategies, risks, expected performance and condition. Forward-looking statements include statements that are predictive in nature, that depend upon or refer to future events and conditions or include words such as “may”, “could”, “would”, “should”, “expect”, “anticipate”, “intend”, “plan”, “believe”, “estimate” and similar forward-looking expressions or negative versions thereof.
These forward-looking statements are subject to various risks, uncertainties and assumptions about the investment strategies, capital markets and economic factors, which could cause actual financial performance and expectations to differ materially from the anticipated performance or other expectations expressed. Economic factors include, but are not limited to, general economic, political and market factors in North America and internationally, interest and foreign exchange rates, global equity and capital markets, business competition, technological change, changes in government regulations, unexpected judicial or regulatory proceedings, and catastrophic events.
Readers are cautioned not to place undue reliance on forward-looking statements and consider the above-mentioned factors and other factors carefully before making any investment decisions. All opinions contained in forward-looking statements are subject to change without notice and are provided in good faith. Forward-looking statements are not guarantees of future performance, and actual results could differ materially from those expressed or implied in any forward-looking statements. Bristol Gate Capital Partners Inc. has no specific intention of updating any forward-looking statements whether as a result of new information, future events or otherwise, except as required by securities legislation.
 Takes 2 minutes