
January 21, 2025
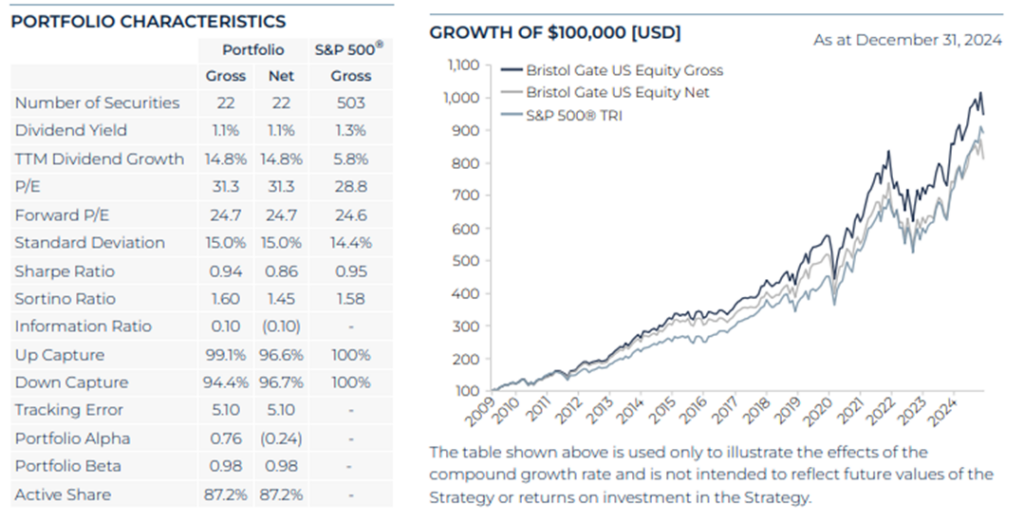
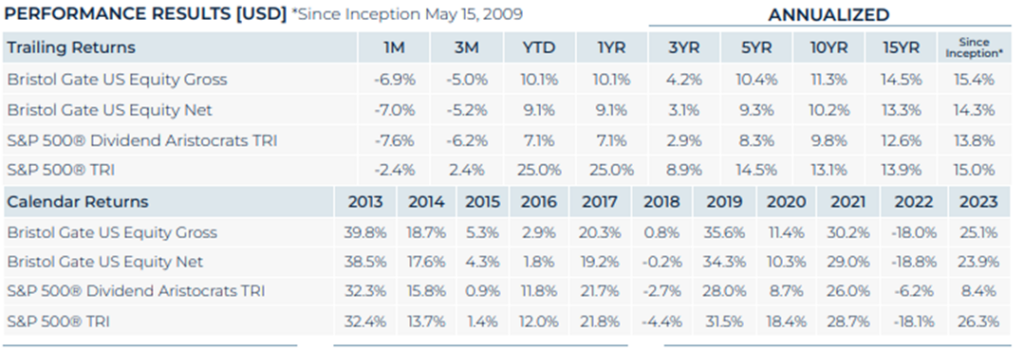
In 2024, the S&P 500 Total Return Index delivered its second consecutive 25%+ annual return. Market concentration was the theme of the strong performance, with the top 10 stocks in the Index accounting for more than 60% of the year’s return and almost 40% of the Index market capitalization as at year end. Our US Equity strategy, which focuses on companies with sustainable and fast-growing dividend streams, had limited exposure to these market leaders by design.
Over the past year, strategies that were focused on investing in dividend growth stocks, like Bristol Gate’s, underperformed the S&P 500 Index. This includes the S&P Dividend Aristocrats Index, a collection of companies in the S&P 500 that have increased their dividends for at least 25 consecutive years, which only increased 7.1% in 2024.
Exhibit 1. 2024 Market Concentration.
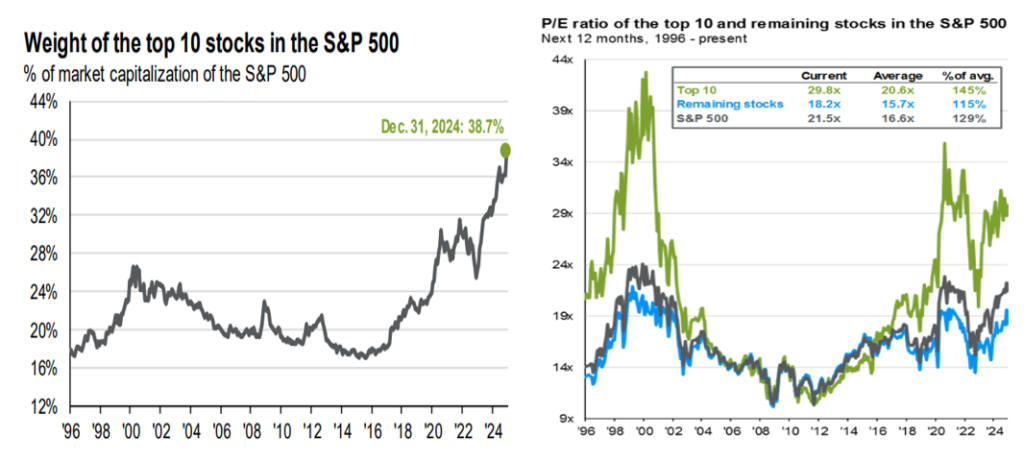
Source: JP Morgan Asset Management, Guide to the Markets Q4/24.
Strategies that pursued broader diversification, such as the S&P 500 Equal Weight Index, also underperformed the S&P 500 Index (weighted by market capitalization). The Equal Weight Index was up by approximately 13% in 2024.
Exhibit 2. Q4-2024 and 2024 Returns.
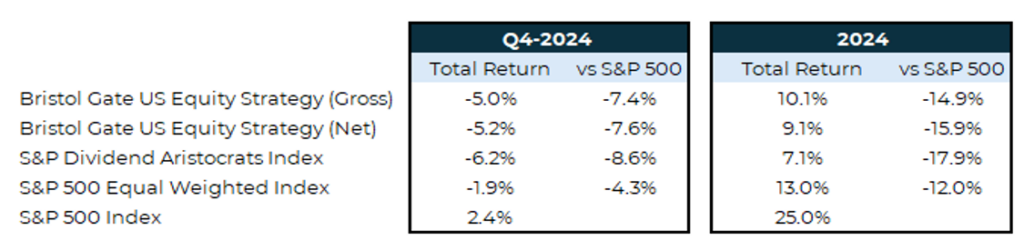
Source: S&P Global, Bristol Gate Capital Partners.
The combination of dividend growth and equal weighting strategies underperforming helps contextualize our largest relative underperformance compared to the S&P 500 Index since our strategy’s inception in 2009.
Like any investor, we are not happy with this underperformance and expect better for our investors and from ourselves. While we are disappointed, it is important to place these results within the broader framework of market history and our long-term investment philosophy.
The Nature of Market Cycles and Concentrated Returns
Periods of concentrated market returns are not new and are usually a difficult time for active managers who build well-diversified portfolios of stocks. The last time the S&P 500 delivered consecutive years of 25%+ returns was 1997 and 1998, during the Dotcom boom. During that period, a small number of high-flying technology companies drove the market to unprecedented levels. Investors gravitated towards businesses with explosive revenue growth, often at the expense of fundamentals like profitability and cash flow.
Following the Dotcom bust, many of those technology darlings of the late 1990s experienced steep declines, while dividend-paying stocks, and more specifically dividend growth stocks, provided stability and meaningful returns during the subsequent decade-long stock market recovery.
In Exhibit 3 below, we use the S&P 500 Dividend Aristocrats Index and the S&P 500 Equal Weight Index as proxies for the dividend growth universe and broader diversification, respectively, to show how diversification and dividend growth have fared over time relative to the S&P 500 Index.
Exhibit 3. The Long-Term Outperformance of the S&P 500 Equal Weighted Index and S&P 500 Dividend Aristocrats Index versus the S&P 500 Index.
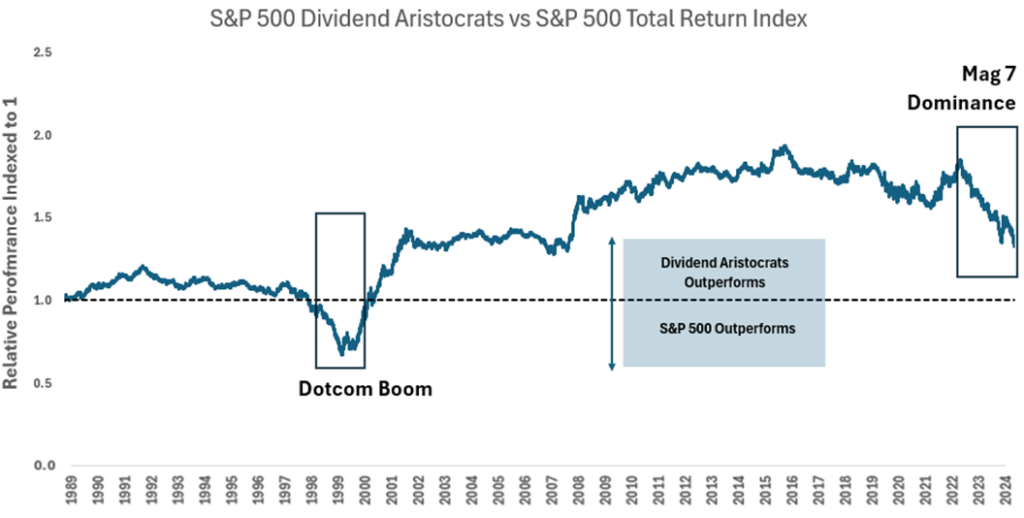
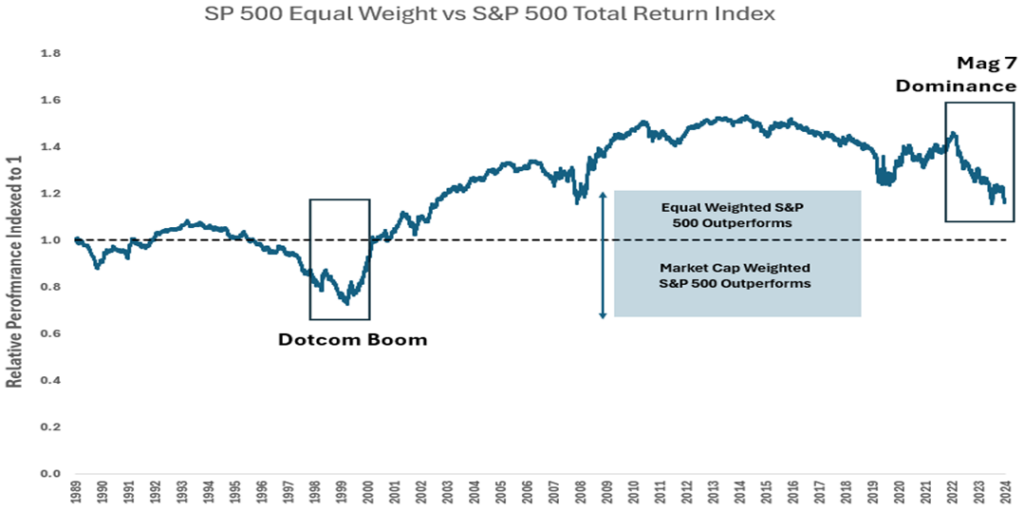
Source: Bloomberg, S&P Global, Bristol Gate Capital Partners. There is a risk of loss inherent in any investment; past performance is not indicative of future results. Data from January 1990 to December 2024.
Today’s concentration is being largely driven by one underlying theme, artificial intelligence. While it’s tempting to focus on what’s currently working in the market, history shows that concentration does not last forever. Markets reward durable businesses that generate cash over time and maintain their investing discipline through difficult periods.
Why We Believe in High Dividend Growth Stocks
Our investment approach is built on the belief that companies with strong free cash flow, disciplined capital allocation, and a track record of growing their dividends at high rates are uniquely positioned to deliver superior risk-adjusted returns over time. These businesses tend to exhibit resilient operating performance across economic cycles and align management incentives with shareholder interests through sustainable dividend policies.
We believe dividend growth rates are good predictors of returns over time and that the fastest dividend growers should produce even better results than the broader dividend growth universe. Our extensive research confirms this, and it is the reason our investment process begins with using artificial intelligence to find the fastest dividend growers of tomorrow.
Exhibit 4. S&P 500 Returns Compared to Earnings, Dividend and US GDP Growth
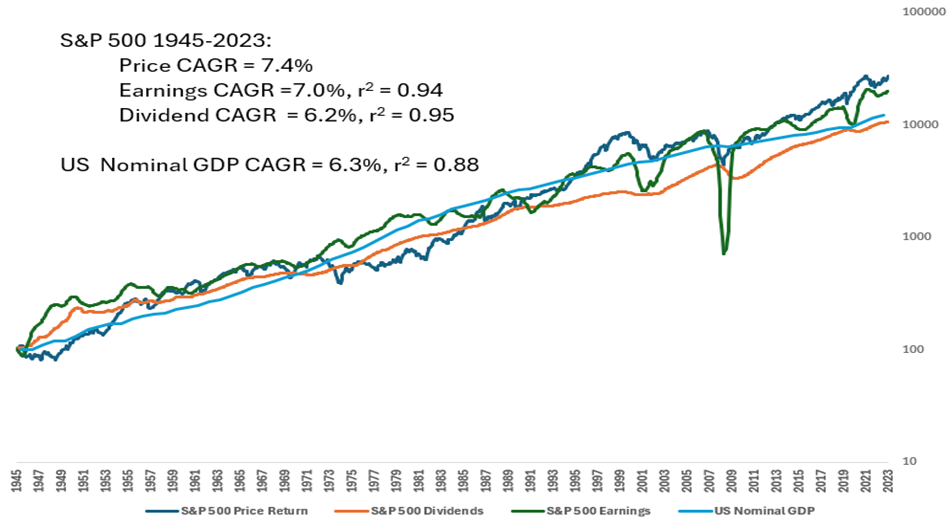
Source: US Bureau of Economic Analysis, Robert Shiller, Aswath Damodaran, Bristol Gate Capital Partners. Chart uses logarithmic scale. Data from January 1946 to December 2024
We believe dividend growth rates are a reasonable proxy for earnings growth and because dividends are relatively stable, they are more predictable than earnings, whose volatility makes them more difficult to forecast.
Looking Ahead
Exhibit 5 demonstrates the annual performance of the following groups of stocks relative to the S&P 500:
• The top 65 stocks of prospective dividend growers in the S&P 500 as predicted by our proprietary machine learning model as at each prior year end (“Bristol Gate Top 65”). This universe is time limited to 1999, when the history of our model’s predictions begins (although we would have expected underperformance in 1998 as well);
• The S&P 500 Dividend Aristocrats Index; and
• The S&P 500 Equal Weight Index.
Exhibit 5. The High Dividend Growth Opportunity.
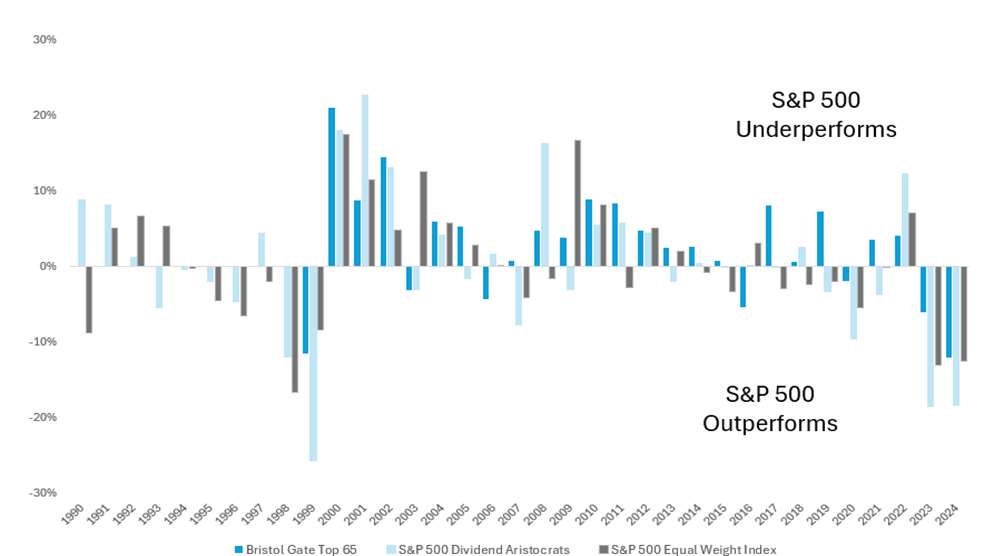
Source: Bristol Gate, Bloomberg, S&P Global in USD. Data from January 1991 to December 2024. There is a risk of loss inherent in any investment; past performance is not indicative of future results.
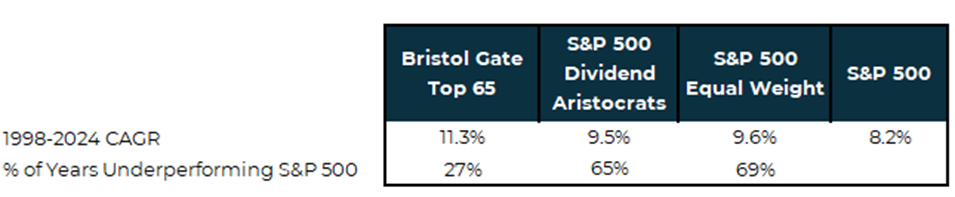
What is interesting from the exhibit above is that both the Dividend Aristocrats and Equal Weight Indexes outperformed the S&P 500 over the entire 35-year period despite underperforming in more than half the years. This suggests that over time there are probably better ways to make capital allocation decisions than those based on market capitalization.
What’s more compelling to us, is the high dividend growth universe achieved outstanding performance despite underperforming the broader index approximately a quarter of the time since 1999, including material underperformance in 1999 (hence the analogy to today). That is our opportunity and why we focus on accurately predicting this group of companies and investing in them based on their strong business characteristics and quality factors.
While periods of underperformance are challenging, they often create opportunities for patient investors who remain disciplined and grounded in their investment approach. We think the current period of underperformance suggests upcoming tailwinds for equal weight and dividend growth strategies given the historic outperformance of each over time, especially after periods of underperformance. We think sticking to a consistent evidence-based approach is the right course of action.
Our research continues to point to strong fundamentals within our portfolio companies, many of which are trading at attractive valuations. At year end, our portfolio was trading at a 3.2% free cash flow yield, a discount compared to the S&P 500 at 2.8%. These are businesses with competitive advantages, healthy balance sheets, and a commitment to rewarding shareholders through a rapidly growing dividend, underlined by the fact our portfolio companies grew their dividends by ~15% over the last twelve months, compared to ~6% for the S&P 500 Index.
As market conditions evolve, we expect a broader rotation out of the companies that have led the market thus far and will ultimately validate our focus on high dividend growth stocks.
4th Quarter 2024 Commentary
US Equity Strategy
Portfolio Results
The US Equity strategy underperformed the S&P 500 Index during Q4 and over the full year. Approximately half the relative drag on the year occurred in the fourth quarter alone and only six of our 22 holdings posted positive returns in Q4. Our relative performance against the Index should be viewed in the context of a very narrow market as discussed earlier and an environment within the dividend universe that saw higher yielding stocks do better than our focus universe of high dividend growers.
Portfolio Dividend Growth – Trailing and consensus forward 12 months.
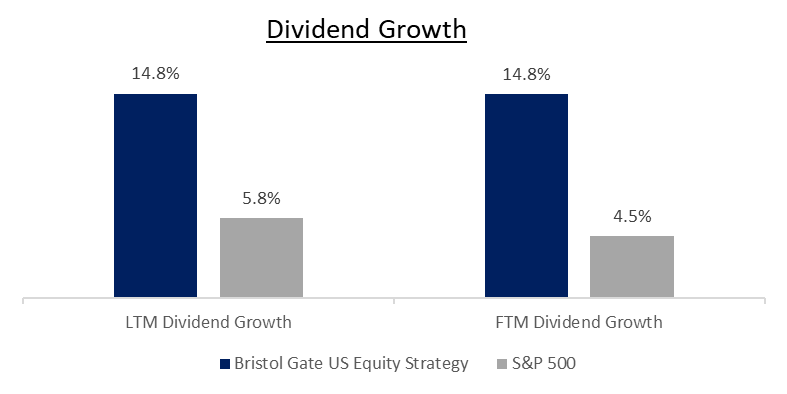
Note: Last 12 months (“LTM”) Dividend Growth is the median of the actual trailing 12-month dividend growth of the individual stocks held by Strategies or Index constituents as reported by Bloomberg as at Dec 31, 2024. Forward 12 months (“FTM”) Dividend Growth is the median of the Bristol Gate Model’s forward 12-month prediction for the individual stocks held by the Strategies and the median of consensus estimates for the constituents of the Indices as of quarter end. Companies without a consensus dividend forecast were excluded.
Source: Bloomberg, FactSet, Bristol Gate Capital Partners.
Contributors
No exposure to Consumer Staples, Real Estate, and Energy contributed positively to relative returns in the quarter.
On an absolute basis, Broadcom, McKesson, and Visa were amongst our best performers during the quarter.
Broadcom has been one of our best performing stocks throughout the year and had another strong quarter, rising almost 30% following their quarterly results in mid December. The company highlighted a $60-90 billion serviceable market by FY27 for AI related businesses (custom chip development and networking), driven by three existing hyperscaler customers with potential upside from an additional two more hyperscale customers the company is currently working with. This was well ahead of market expectations. We had viewed the opportunity for Broadcom’s AI business as underappreciated by the market and believed “Nvidia’s sales today are Broadcom’s opportunity tomorrow.” As these hyperscalers move from general purpose GPUs to Broadcom’s custom developed ASICs chips for certain applications to attain better performance per power input, Broadcom stands to benefit. If our view of how the hyperscaler data centre develops is correct, we believe Broadcom’s forecast of a $60-90 billion serviceable market by FY27 will prove to be conservative.
McKesson outperformed this quarter after being one of our largest detractors in the prior quarter. The company posted strong quarterly results on higher prescription volumes in the US Pharmaceutical segment and demonstrated growth in their specialty products and generic segments. We continue to believe the company is attractively valued and that underlying trends in its drug distribution business (aging population), continued capital allocation in its oncology franchise and broader adoption of its Prescription Technology Solutions will support management’s 12-14% EPS long-term CAGR target.
Entering the quarter, sentiment around Visa was poor due to the US Department of Justice filing a civil antitrust lawsuit against the company in September for monopolization & unlawful conduct in debit network markets. This isn’t the first time Visa (or Mastercard) has faced regulatory challenges, nor do we expect it to be the last time. Each time the companies have faced such hurdles, they have recovered due to the significant opportunity that remains in digitizing consumer and business payment flows. This was once again on display when Visa reported quarterly results delivering double-digit year-over-year revenue growth on the back of strong volume in payments. The company also announced a 13% increase in their dividend and a $7 billion share buyback authorization, indicating management’s confidence in the outlook going forward.
Over the full year, having no exposure to Energy, Consumer Staples, and Utilities contributed positively to relative returns. Broadcom, Carrier and Cintas were the largest contributors to absolute returns for the year.
Detractors
Stock selection in the Industrials, Consumer Discretionary, and Information Technology sectors detracted from returns in the period. Additionally, being overweight in Industrials and underweight in Consumer Discretionary and Information Technology further negatively impacted performance.
On an absolute basis, Microchip Technology, Applied Materials, and Zoetis were our weakest performers in the period.
Microchip continues to face revenue pressures due to the destocking cycle that has lasted longer and been deeper than expected. In December, the company reduced its quarterly revenue outlook and announced additional restructuring plans in light of the demand weakness. While we don’t know when the destocking cycle will end, we do know that it eventually will. With recent year over year revenue declines exceeding those experienced during COVID, the global financial crisis and the 2001 recession, we believe the stage is being set for a strong recovery in volumes when demand does return. We continue to monitor the company’s performance closely.
Despite reporting Q4 results that were ahead of consensus estimates, Applied Materials’ stock struggled on a weaker than expected revenue outlook. The company also didn’t offer much colour beyond Q1/25 with respect to growth in the wafer fab equipment market and the impact of export controls on Chinese demand. The lack of visibility was enough to overshadow positive near and long term trends such as continued strength in leading edge logic and gate all around architectures, advanced packaging, high bandwidth memory, integrated systems and a growing service mix. We believe the company remains very well positioned to capitalize on the need for energy-efficient computing driving growth and innovation in the semiconductor industry.
Zoetis lagged despite posting strong quarterly results due to negative headlines surrounding their new osteoarthritis (OA) drug launched in the US, Librela. The FDA’s Center for Veterinary Medicine notified veterinarians about reported adverse events for Librela via a “Dear Veterinarian Letter”. No other action was prescribed and the FDA reiterated that it determined Librela to be safe and effective for its intended use for control of pain associated with osteoarthritis in dogs. However, the FDA is recommending an updated label to include a section on “Post Approval Experience” that buckets adverse events into neurological, general, renal/urinary, gastrointestinal, and musculoskeletal events. We view the Dear Veterinarian Letter as a marginal negative for Zoetis as the US launch of Librela has been one of the key focuses for investors. At a recent investor event in November, the company said that they have treated nearly 1 million dogs in the US with Librela, implying 0.36% rate of reported adverse events, not high enough in our opinion to materially impact demand. In addition, we understand that some of FDA’s recommended label changes are already included on labels outside the US and will likely be incorporated in the US going forward. Although the stock has struggled this year, we continue to have a positive outlook on Zoetis’ long-term fundamentals, driven by the ongoing trend of the humanization of pets, higher animal proteins in diets as emerging market consumers grow wealthier, and the company’s innovation pipeline.
For the full year, in addition to not owning six of the “Magnificent 7” stocks, stock selection in the Information Technology and Industrials sectors detracted from returns. Additionally, the overweight allocation in the Health Care sector also negatively impacted performance. Microchip, Zoetis and American Tower (sold in the first quarter) were among our largest detractors.
Although it wasn’t one of the largest detractors for the quarter or year, we also want to address UnitedHealth (UNH) due to the tragic event on December 5th, when Brian Thompson, CEO of UnitedHealthcare’s Insurance segment, was killed in a targeted attack outside the UNH Investor Day event in New York City. Our thoughts and deepest condolences go out to Mr. Thompson’s family, friends, and colleagues during this incredibly difficult time.
As portfolio managers, it is necessary to evaluate events like this from an investment perspective, even amidst their profound personal impact. From that standpoint, UNH’s stock fell 17% from the day of the event to year end. The company has had its fair share of challenges this year: rising medical costs, higher healthcare utilization, and a more difficult regulatory environment were all top of mind for investors heading into the conference.
The biggest change following the events of December 5th was the negative sentiment and media attention the company received, including inaccurate or incomplete reporting across established news agencies and social media regarding denied insurance claims. We believe this is one of the main reasons for the stock’s decline during the month. Contrary to the widely circulated reports, UNH confirmed that less than 1% of all claims are reviewed due to medical or clinical reasons, a tiny fraction of rates reported in the media.
Before the Investor Day event was understandably cut short, UNH shared a 2025 outlook that aligned largely with consensus expectations. A slightly improved revenue forecast was balanced by higher anticipated medical costs, while the company reaffirmed its long-term EPS growth targets of 13-16%, supported by its robust position in the growing trend toward value-based care. With its integrated capabilities in care delivery, data, and technology, we believe UNH remains well-positioned to achieve sustainable growth and lower healthcare costs while improving outcomes. It has a strong and capable leadership team, and we are confident in the company’s ability to navigate these turbulent times without disruption to its strategic direction.
Transactions
As per our quarterly rebalancing process, we trimmed our position in Carrier Global. The proceeds were reallocated to Microchip Technology and Applied Materials.
Subsequent to quarter end, we made two changes to the portfolio selling CSX Corp and Corteva Inc. and buying Westinghouse Air Brake Technology Corp. and Eli Lilly and Co. in their place. We will have more on those transactions in next quarter’s letter.
Source: Bristol Gate Capital Partners. There is a risk of loss inherent in any investment; past performance is not indicative of future results. Please see important disclosures at end of document.
Canadian Equity Strategy
Market Recap
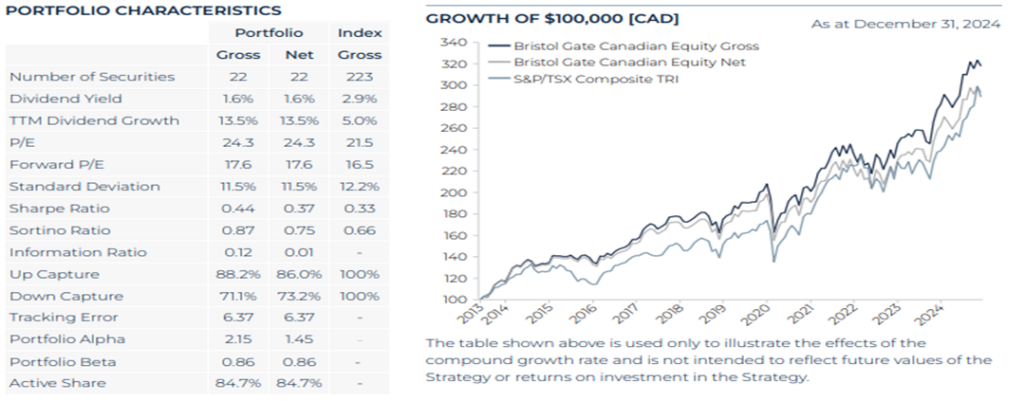
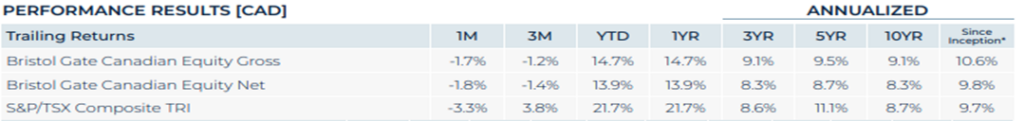
The S&P/TSX Composite Index returned ~22%, keeping pace with the S&P 500 Index despite not having the technology stocks that drove the majority of the returns for the US index.
The Bank of Canada responded to the lack of growth in the Canadian economy with five rate cuts during the year. After two years of underperforming the index, the Financials sector had a strong year and, given its large weight in the TSX, played a large part in the broad market’s gains for the year. Additionally, it was a strong year for the commodity sectors as both Energy and Materials returned over 20%, and the Technology sector’s gains were paced by Shopify which rose by almost 50% during the year.
Portfolio Results
The Canadian Equity strategy underperformed the benchmark in both the quarter and during 2024.
Our strategy looks different than the Canadian index – we had no exposure to Shopify or the Energy sector and were underweight the Financials sector (we added our only exposure to banks in Q4 with our investment in EQB Inc.). In the highly cyclical Canadian market, short-term noise can often drown out strong fundamentals. Despite a challenging year for our performance relative to the S&P/TSX Composite, we remain focused on our process that has delivered attractive long-term results.
The strategy’s returns benefited from strong selection in Consumer Staples (Dollarama) and Industrials, where Element Fleet, Waste Connections and Thomson Reuters all helped. The performance of our positions in the financial sector (Brookfield Corp, TMX, Intact and EQB from October) also helped drive strategy returns. We think these returns demonstrate our ability to find great companies beyond traditional portfolio holdings like the big 6 banks.
The sound fundamentals of our portfolio companies give us confidence that better days await. Our holdings in aggregate grew their dividends by over 13% over the last twelve months, as compared to just 5% for the S&P/TSX Composite. The dividend growth of our portfolio companies was on the back of results of median ~9% sales growth and ~4% earnings growth versus ~5% and ~0.5% for the broad market, respectively.
As we continue to navigate a trying period for the Canadian economy, we continue to believe our differentiated offering of a concentrated portfolio of high quality, high dividend growth businesses will benefit investors going forward.
Portfolio Dividend Growth – Trailing and consensus forward 12 months.

Note: Last 12 months (“LTM”) Dividend Growth is the median of the actual trailing 12-month dividend growth of the individual stocks held by Strategies or Index constituents as reported by Bloomberg as at Dec 31, 2024. Forward 12 months (“FTM”) Dividend Growth is the median of the Bristol Gate Model’s forward 12-month prediction for the individual stocks held by the Strategies and the median of consensus estimates for the constituents of the Indices as of quarter end. Companies without a consensus dividend forecast were excluded.
Source: Bloomberg, FactSet, Bristol Gate Capital Partners.
Contributors
An underweight position in Communication Services, along with no exposure to Utilities, contributed positively to returns during the period.
On an absolute basis, Broadcom, Brookfield Corp., and TFI International were amongst our best performers in the period.
Broadcom experience strong stock performance as the market continues to develop a better appreciation of the enormous opportunity and runway for growth the company has in developing custom chips and the levels of demand that exist.
Brookfield Corporation outperformed on record financial results, achieving an almost 20% increase year-over-year in distributable earnings. Strong growth alongside successful fundraising efforts and strategic acquisitions contributed to robust cash flows, positioning the company favorably in the market.
TFI outperformance was driven by resilient quarterly results, including growing revenues driven by strong logistics performance and strategic acquisitions. Additionally, growth in free cash flow enhanced debt reduction efforts, positioning the company favorably amidst a challenging market in terms of volumes.
For the year, stock selection in the Consumer Discretionary sector and Industrials, as well as an overweight to Communication Services, contributed to returns.
Detractors
Stock selection in the Information Technology, Health Care, and Financials sectors detracted from returns in the period. Additionally, the underweight position in the Financials sector also negatively impacted performance.
On an absolute basis, Stella-Jones, Enghouse Systems, and Premium Brands Holdings were amongst our weakest performers in the period.
Stella-Jones underperformed despite a significant year-over-year net income rise on market concerns about inventory levels and slower growth in key segments, which we believe are short-term in nature and remain confident in the long-term fundamentals of the business.
Enghouse trailed the market on results that did not meet market expectations on top line revenue. We believe discerning investors will see through the noise that the company’s acquisitions have on their reported results. The company’s SaaS segment continues to grow, and recurring revenues now make up over 70%. The company has ample cash on hand and continues to seek out strategic acquisitions and expects to continue to grow the dividend.
Premium Brands lagged as management revised their outlook downwards primarily given the weakness in sales at Starbucks, which represents a meaningful portion of revenues. We continue to monitor the company’s long-term growth prospects against our original investment thesis.
For the full year, stock selection in the Consumer Staples and Health Care sectors detracted from returns in the period. More impactful was stock selection in the Technology sector, as the two software consolidators that we own (Enghouse Systems and Open Text Corp.) had a challenging year both operationally and from a returns standpoint. Ongoing transition to SaaS and efforts to stay relevant in an AI-led world had both companies struggling to find traction with investors. We continue to monitor the situation in both names and at current valuations we are optimistic about the future.
Transactions
During the quarter, we exited our investments in InterRent REIT and Telus Corp. We initiated new investments in TFI International and EQB Inc.
TFI is a leading logistics company with exposure in the Less-Than-Truckload (LTL) and Truckload industry. The company has been a savvy operator and value creating capital allocator through M&A and organic re-investment. A track of record of strong dividend growth accompanied by a recovery in North American freight volumes and pricing underpin a strong management team and high-quality business.
EQB is a leading alternative financial lender targeting high quality borrowers that are not served by the big six. With the tailwind of a growing domestic population the company has a strong track record of prudent underwriting, and a history of attractive shareholder returns in addition to leading dividend growth.
In addition, as per our quarterly rebalancing process, we trimmed our positions in Brookfield Corp. and Colliers International Group and increased our investments in Alimentation Couche-Tard, Enghouse Systems Ltd. and Canadian National Railway Co.
Source: Bristol Gate Capital Partners. There is a risk of loss inherent in any investment; past performance is not indicative of future results. Please see important disclosures at end of document.
Firm Update
To all our clients:
Our business progress has continued to advance despite headwinds facing active investment managers, as discussed previously. Our US Equity strategy is now available on some of the largest North American distribution platforms, and we continue to see interest in this regard. Our success is due to the fact that our investment approach is recognized as being very differentiated and complementary to other dividend, value and growth managers. In short, we are a good fit for clients’ investment needs.
We remain committed to delivering long-term value and appreciate your patience as we navigate this period of market divergence. Should you have any questions or wish to discuss our strategy further, please do not hesitate to reach out.
Wishing you a prosperous and healthy year ahead,
The Bristol Gate Team
Important disclosures
There is a risk of loss inherent in any investment; past performance is not indicative of future results. Prospective and existing investors in Bristol Gate’s pooled funds or ETF funds should refer to the fund’s offering documents which outline the risk factors associated with a decision to invest. Separately managed account clients should refer to disclosure documents provided which outline risks of investing. Pursuant to SEC regulations, a description of risks associated with Bristol Gate’s strategies is also contained in Bristol Gate’s Form ADV Part 2A located at www.bristolgate.com/regulatory-documents.
The information contained herein is obtained from multiple sources that are believed to be reliable. However, such information may not have been verified, and may be different from the information included in documents and materials created by a sponsor firm in whose investment program a client participates. Some sponsor firms may require that these Bristol Gate materials are preceded or accompanied by investment profiles or other documents or materials prepared by such sponsor firms, which will be provided upon a client’s request. There may be discrepancies between Bristol Gate’s performance returns and the returns included in a sponsor firm’s profile document (for example, but not limited to, differences in account size/type, portfolio management strategies, the number of securities held, average account size, inclusion of institutional or mutual fund accounts, etc.) For additional information, documents and/or materials, please speak to your Financial Advisor.
US Equity Strategy returns in this report refer to the Bristol Gate US Equity Strategy Composite (the “US Composite”). The US Composite consists of equities of publicly traded, dividend paying US companies. The US Composite is valued in US Dollars and for comparison purposes is measured against the S&P 500 Total Return Index. The US Composite’s Investment Advisor, Bristol Gate Capital Partners Inc., defines itself as a portfolio manager, exempt market dealer and investment fund manager (as per its registration in Ontario, its principal regulator in Canada) and is also a Registered Investment Adviser with the U.S. Securities and Exchange Commission (the “SEC”). The Investment Advisor’s objective is to select companies with positive dividend growth, and which collectively will generate over the long term a growing income and capital appreciation for investors. The inception date of the US Composite is May 15, 2009. The US Dollar is the currency used to measure performance, which is presented on a gross and net basis and includes the reinvestment of investment income. The US Composite’s gross return is gross of withholding tax prior to January 1, 2017 and is net of withholding tax thereafter. Net returns are calculated by reducing the gross returns by the maximum management fee charged by Bristol Gate of 1%, applied monthly. Actual investment advisory fees incurred by clients may vary. There is the opportunity for the use of leverage up to 30% of the net asset value of the underlying investments using a margin account at the prime broker. Thus far no material leverage has been utilized. An investor’s actual returns may be reduced by management fees, performance fees, and other operating expenses that may be incurred because of the management of the US Composite. A performance fee may also be charged on some accounts and funds managed by the firm. Bristol Gate claims compliance with the Global Investment Performance Standards (GIPS®). GIPS® is a registered trademark of CFA Institute. CFA Institute does not endorse or promote this organization, nor does it warrant the accuracy or quality of the content contained herein. To obtain a GIPS Composite Report, please email us at info@bristolgate.com.
The S&P 500® Total Return Index measures the performance of the broad US equity market, including dividend re-investment, in US dollars. This index is provided for information only and comparisons to the index has limitations. The benchmark is an appropriate standard against which the performance of the strategy can be measured over longer time periods as it represents the primary investment universe from which Bristol Gate selects securities. However, Bristol Gate’s portfolio construction process differs materially from that of the benchmark and the securities selected for inclusion in the strategy are not influenced by the composition of the benchmark. For example, the strategy is a concentrated portfolio of approximately equally weighted dividend-paying equity securities, rebalanced quarterly whereas the benchmark is a broad stock index (including both dividend and non-dividend paying equities) that is market capitalization weighted. As such, strategy performance deviations relative to the benchmark may be significant, particularly over shorter time periods. The strategy has concentrated investments in a limited number of companies; as a result, a change in one security’s value may have a more significant effect on the strategy’s value.
In addition to the US Equity strategy’s benchmark described above, the following additional Index data may be presented for information purposes only and comparisons to these Indices has limitations:
The S&P 500® Equal Weight Index (EWI) is the equal-weight version of the widely-used S&P 500. The index includes the same constituents as the capitalization weighted S&P 500, but each company in the S&P 500 EWI is allocated a fixed weight – or 0.2% of the index total at each quarterly rebalance. The index is used to highlight the impact of concentration in the market cap weighted index but it does not solely focus on dividend paying securities, whereas Bristol Gate’s US Equity strategy’s securities are selected based on future dividend growth.
S&P 500 ® Total Return Dividend Aristocrats Index measures the performance of a subset of S&P 500® Index companies that have increased their dividends every year for the last 25 consecutive years. This Index focuses on historical dividend growth, whereas Bristol Gate’s US Equity strategy’s securities are selected based on future dividend growth.
SPDR® S&P 500® ETF Trust (SPY US) sourced from Bloomberg has been used as a proxy for the S&P 500® Total Return Index for the purpose of providing non-return-based portfolio statistics and sector weightings in this report. SPY US is an ETF that seeks to provide investment results that, before expenses, correspond generally to the price and yield performance of the S&P 500® Index.
Canadian Equity Strategy returns in this report refer to the Bristol Gate Canadian Equity Strategy Composite (the “Canadian Composite”). The Canadian Composite consists primarily of equities of publicly traded, dividend paying Canadian companies. The Canadian Composite is valued in Canadian Dollars and for comparison purposes is measured against the S&P/TSX. The Canadian Composite’s Investment Advisor, Bristol Gate Capital Partners Inc., defines itself as a portfolio manager, exempt market dealer and investment fund manager (as per its registration in Ontario, its principal regulator in Canada) and is also a Registered Investment Adviser with the U.S. Securities and Exchange Commission (the “SEC”). The Investment Advisor’s objective is to select companies primarily from the S&P/TSX universe with positive dividend growth and which collectively will generate over the long term a growing income and capital appreciation for investors. The inception date of the Canadian Composite is July 1, 2013. Returns are presented gross and net of fees and include the reinvestment of all income. The Canadian composite’s gross return is gross of withholding tax prior to January 1, 2017 and is net of withholding tax thereafter. Net returns are calculated by reducing the gross returns by the maximum management fee charged by Bristol Gate of 0.7%, applied monthly. Actual investment advisory fees incurred by clients may vary. An investor’s actual returns may be reduced by management fees, performance fees, and other operating expenses that may be incurred because of the management of the Canadian Composite. A performance fee may be charged on some accounts and funds managed by the firm. Bristol Gate claims compliance with the Global Investment Performance Standards (GIPS®). GIPS® is a registered trademark of CFA Institute. CFA Institute does not endorse or promote this organization, nor does it warrant the accuracy or quality of the content contained herein. To obtain a GIPS Composite Report, please email us at info@bristolgate.com.
The returns have been converted into Canadian Dollars using the prevailing Canadian/United States dollar exchange rate.
The S&P/TSX Total Return Index measures the performance of the broad Canadian equity market, including dividend re-investment, in Canadian dollars. This index has been provided for information only and comparisons to the index has limitations. The benchmark is an appropriate standard against which the performance of the strategy can be measured over longer time periods as it represents the primary investment universe from which Bristol Gate selects securities. However, Bristol Gate’s portfolio construction process differs materially from that of the benchmark and the securities selected for inclusion in the strategy are not influenced by the composition of the benchmark. For example, the strategy is a concentrated portfolio of approximately equally weighted dividend-paying equity securities, rebalanced quarterly whereas the benchmark is a broad stock index (including both dividend and non-dividend paying equities) that is market capitalization weighted. As such, strategy performance deviations relative to the benchmark may be significant, particularly over shorter time periods. The strategy has concentrated investments in a limited number of companies; as a result, a change in one security’s value may have a more significant effect on the strategy’s value.
iShares Core S&P®/TSX® Capped Composite Index ETF (XIC CN) sourced from Bloomberg has been used as a proxy for the S&P®/TSX® Total Return Index for the purpose of providing non-return-based portfolio statistics and sector weightings in this report. XIC CN is an ETF that seeks long-term capital growth by replicating the performance of the S&P®/TSX® Capped Composite Index, net of expenses.
This Report is for information purposes and should not be construed under any circumstances as a public offering of securities in any jurisdiction in which an offer or solicitation is not authorized. Prospective investors in Bristol Gate’s pooled funds or ETF funds should rely solely on the fund’s offering documents, which outline the risk factors associated with a decision to invest. No representations or warranties of any kind are intended or should be inferred with respect to the economic return or the tax implications of any investment in a Bristol Gate fund.
This piece is presented for illustrative and discussion purposes only. It should not be considered as personal investment advice or an offer or solicitation to buy and/or sell securities and it does not consider unique objectives, constraints, or financial needs of the individual. Under no circumstances does this piece suggest that you should time the market in any way or make investment decisions based on the content. Investors are advised that their investments are not guaranteed, their values change frequently, and past performance may not be repeated. References to specific securities are presented to illustrate the application of our investment philosophy only, do not represent all of the securities purchased, sold or recommended for the portfolio, and it should not be assumed that investments in the securities identified were or will be profitable and should not be considered recommendations by Bristol Gate Capital Partners Inc. A full list of security holdings is available upon request. For more information contact Bristol Gate Capital Partners Inc. directly. The information contained in this piece is the opinion of Bristol Gate Capital Partners Inc. and/or its employees as of the date of the piece and is subject to change without notice. Every effort has been made to ensure accuracy in this piece at the time of publication; however, accuracy cannot be guaranteed. Market conditions may change and Bristol Gate Capital Partners Inc. accepts no responsibility for individual investment decisions arising from the use of or reliance on the information contained herein. We strongly recommend you consult with a financial advisor prior to making any investment decisions. Please refer to the Legal section of Bristol Gate’s website for additional information at bristolgate.com.
A Note About Forward-Looking Statements
This report may contain forward-looking statements including, but not limited to, statements about the Bristol Gate strategies, risks, expected performance and condition. Forward-looking statements include statements that are predictive in nature, that depend upon or refer to future events and conditions or include words such as “may”, “could”, “would”, “should”, “expect”, “anticipate”, “intend”, “plan”, “believe”, “estimate” and similar forward-looking expressions or negative versions thereof.
These forward-looking statements are subject to various risks, uncertainties and assumptions about the investment strategies, capital markets and economic factors, which could cause actual financial performance and expectations to differ materially from the anticipated performance or other expectations expressed. Economic factors include, but are not limited to, general economic, political and market factors in North America and internationally, interest and foreign exchange rates, global equity and capital markets, business competition, technological change, changes in government regulations, unexpected judicial or regulatory proceedings, and catastrophic events.
Readers are cautioned not to place undue reliance on forward-looking statements and consider the above-mentioned factors and other factors carefully before making any investment decisions. All opinions contained in forward-looking statements are subject to change without notice and are provided in good faith. Forward-looking statements are not guarantees of future performance, and actual results could differ materially from those expressed or implied in any forward-looking statements. Bristol Gate Capital Partners Inc. has no specific intention of updating any forward-looking statements whether as a result of new information, future events or otherwise, except as required by securities legislation.
 Takes 2 minutes