
July 16, 2024
Performance Summary
During the quarter, the US Equity Strategy underperformed the S&P 500 Index while the Canadian Equity strategy outperformed the S&P/TSX Composite. Both the strategies also continued to outpace their respective benchmarks in terms of dividend growth. For a more detailed discussion on performance see each Strategy’s respective section below.
Portfolio Dividend Growth – Trailing and consensus forward 12 months.
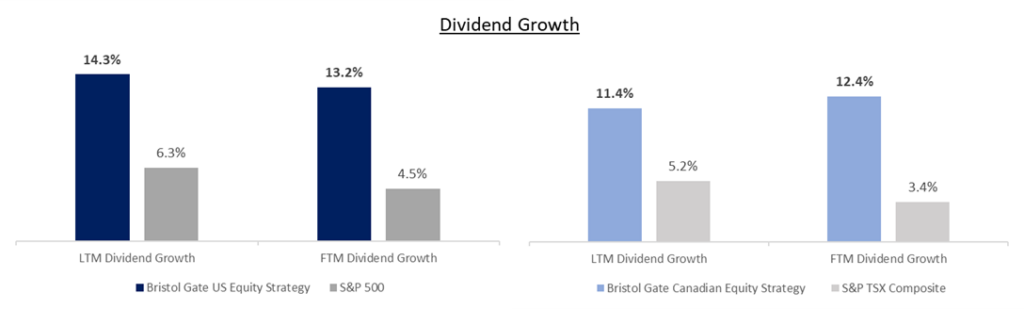
Note: Last 12 months (“LTM”) Dividend Growth is the median of the actual trailing 12-month dividend growth of the individual stocks held by Strategies or Index constituents as reported by Bloomberg as at June 30, 2024. Forward 12 months (“FTM”) Dividend Growth is the median of the Bristol Gate Model’s forward 12-month prediction for the individual stocks held by the Strategies and the median of consensus estimates for the constituents of the Indices as of quarter end. Companies without a consensus dividend forecast were excluded.
Source: Bloomberg, FactSet, Bristol Gate Capital Partners.
15 Years Back and 15 Years Forward
In May 2024, Bristol Gate celebrated its 15-year anniversary of our US Equity Strategy. As we did when we reached our ten-year anniversary, we thought it would be worth revisiting what has allowed us to succeed over that time, and why we believe this approach will continue to offer opportunities for many years to come.
Our approach is one of high conviction: We build concentrated portfolios of 22 stocks. Our conviction is based on evidence: history tells us that investing in the highest dividend growers results in attractive long-term results. Concentration ensures a certain standard must be met before we consider investing our clients’ and our own capital.
Exhibit 1: The Opportunity
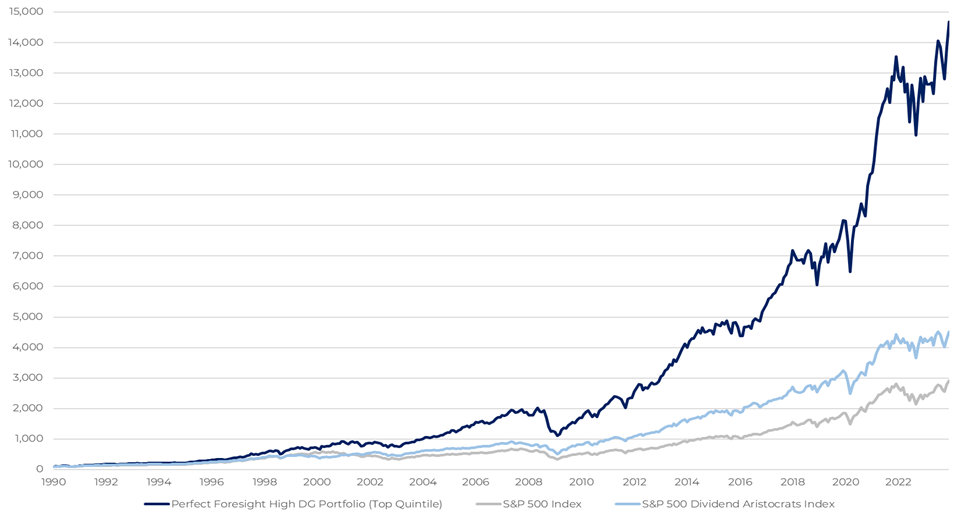
The chart above illustrates if you would have had the foresight to invest in the best dividend growth stocks (“Top Quintile”) in the S&P 500 over the period. The period referenced is from Jan 1, 1990, to Dec 31, 2023, in USD where each theoretical portfolio presented for the stated category was constructed from an equal weight basket of stocks selected from the S&P 500 universe and reconstituted annually. For illustration purposes only, past performance is not indicative of future results. Source: Bristol Gate Capital Partners, Bloomberg
Everything we do begins with finding and predicting high dividend growth. Exhibit 1 demonstrates the theoretical performance of the high dividend growth universe if you were able to perfectly predict dividend growth. Our own predicted universe is adjusted with the addition of key investment processes we have followed since our outset to further improve our choices to make the portfolio better suited to our clients. These have not changed since our inception and are repeated below:
Keys To Our Successful Investment Strategy
- Investing in high-return businesses: Companies capable of growing and returning excess free cash flow through dividends.
- Avoiding excessive risk: Steering clear of companies with limited operating history, poor balance sheets, or weak business models.
- Reducing valuation risk: Using equal weighting and quarterly rebalancing to improve an investor’s return on each holding, particularly for high-quality companies.
- Building a concentrated portfolio: Selecting and balancing risks to produce lower downside capture.
Our Investment Results: The outcome of our process
As process-driven investors, we firmly believe our results are the natural outcome of our investment process. The chart below plots our performance against our peers in the dividend and income universe over the last 15 years.
Exhibit 2: Our 15 Year Returns vs Dividend & Income Peer Group
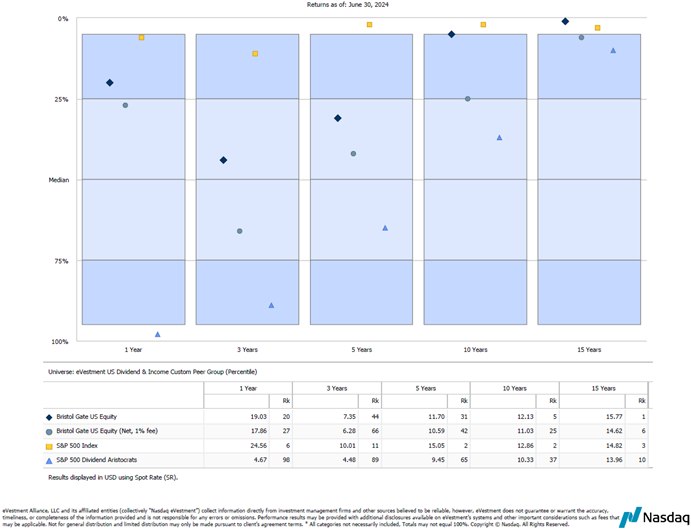
Source: eVestment – July 12th, 2024. The eVestment US Dividend & Income Peer Group is a custom universe we have created based on a review of long-only dividend and/or equity income focused US large-cap strategies within the eVestment database. Bristol Gate Capital Partners Inc. pays a licensing fee to eVestment to access their database. There is a risk of loss inherent in any investment; past performance is not indicative of future results. See full performance history of Bristol Gate US Equity strategy in the commentary section and important disclosures at end of document.
When compared to our peers in the dividend investing universe, these results stand out. As a forward-looking dividend strategy focused on dividend growth, we believe we are in a better position to deliver returns for investors. Over 15 last years, we have outperformed the S&P 500 Dividend Aristocrats Index, one of the most well-regarded dividend growth benchmarks, putting us in select company. Furthermore, our ability to compete with the S&P 500, in a period that has not favoured dividend strategies, is something we take great comfort in.
Our long-term success has included challenging periods. When we measure our performance against our investable universe of dividend-paying stocks, you can see we have had years where we underperformed that universe:
Exhibit 3: Performance versus investable universe of dividend paying stocks in the S&P 500 Index.
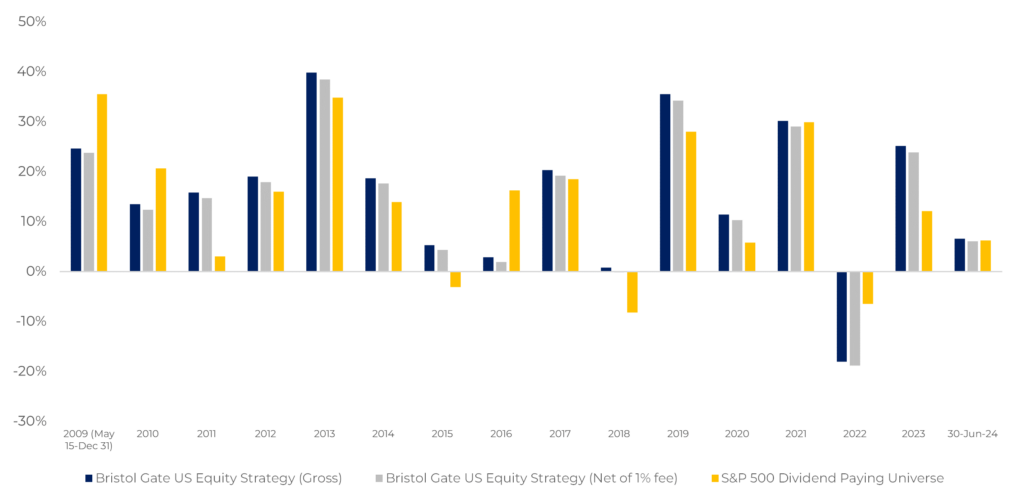
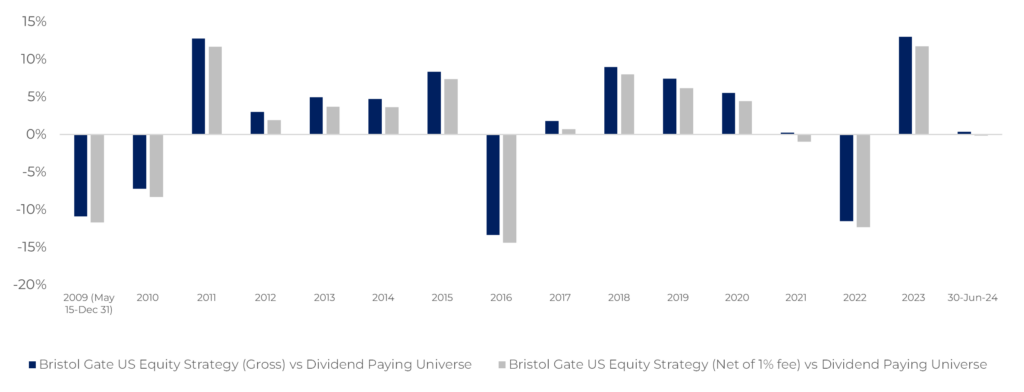
Source: Bristol Gate Capital Partners, Bloomberg. As at June 30, 2024. Gross and net returns. Universe methodology: At the beginning of each year own a portfolio of equal-weighted stocks of companies from S&P 500 that paid a dividend in the previous 12 months, rebalanced and reconstituted annually. There is a risk of loss inherent in any investment; past performance is not indicative of future results. Please see important disclosures at end of document.
Active investment strategies will inevitably have periods of underperformance, but we believe a well-constructed and proven approach like high dividend growth investing will be an odds-on favourite for long-term outperformance.
Our Process: The foundation of our results
The strength of our performance is backed up by our steadfast adherence to our investment principles. Since our firm’s inception, our investment process has started from a singular focus: Predicting dividend growth. Our model has evolved over time, leveraging advanced data analysis and machine learning to improve our ability to identify top dividend growers. This model is the first pillar in our process, followed by traditional fundamental analysis to validate dividend growth predictions, confirm business quality, and estimate intrinsic value, reducing valuation risk. The final pillar in our process is once again driven by data science. We use correlation and statistical analysis to identify potential risks and ensure that while our portfolios are concentrated, that they are also appropriately diversified. By employing an equal-weighted approach to portfolio construction and rebalancing quarterly to capitalize on short-term mispricing, we believe our process enhances the return potential for each holding.
There is no secret to what we do. Our returns are driven by the returns generated by the companies we own. Our focus on dividends is based on our historical understanding of the high dividend growth space. We believe dividends impose discipline amongst company management teams, as the market severely punishes cutting a dividend. We focus on fast-growing dividends because this growth is a strong signal of underlying earnings power and future free cash flow growth.
Investing in companies which generate high operating profits and reinvest those profits back into their businesses is a virtuous circle that leads to compounding intrinsic value. If we can identify and buy those companies at a fair price, then high long-term investment returns should follow. Our conceptual return framework succinctly details the power of owning a business that can generate high incremental returns on capital:
Exhibit 4: Conceptual Return Framework
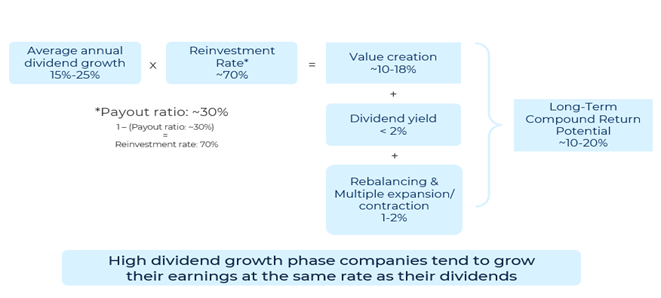
For illustration purposes only. The above is not a targeted return nor a projected return; it is an application of the Gordon Growth model and how we believe we have generated historical returns for the Bristol Gate US Equity Strategy.
Our culture of continuous improvement drives us to consistently invest in finding ways to improve our process, enhancing our informational and analytical edge. Since we published our ten-year letter, we have leveraged our data science team to continue to look for ways to improve investor outcomes:
- We have made improvements to our quarterly rebalancing process, moving to thresholds that must be exceeded before names are rebalanced back to equal weight. Our data science team found that this adjustment lowered trading costs and had no impact on our alpha potential.
- We continue our efforts to not only improve the accuracy of our current model’s dividend predictions but have also been able to extend our prediction further beyond 12 months.
- We have built portfolio composition risk management tools to seek to better optimise risk.
- We continue to study our high dividend growth universe to better understand the investing signals from our models and the how persistent high dividend growth can deliver higher returns.
We believe our ‘human & machine’ approach provides us with a sustainable behavioral edge, which is the key to active management success. We leverage technology to eliminate biases that otherwise impair traditional managers. Bristol Gate remains committed to continuous improvement and learning, aligning our interests with our investors for continued success in the future.
US Equity Strategy
Market Recap
The S&P 500 rose over 4% in the second quarter, boosted by surging semiconductor stocks and tech mega-caps even as the majority of the index declined. The economy is showing signs of improvement however, as S&P 500 companies excluding the Magnificent 7 are starting to show healthier earnings growth.
Portfolio Results
The US Equity strategy underperformed the benchmark in the period. The narrowness of the market has been a headwind for all dividend-oriented strategies, but our results are in line with those of the dividend paying universe year-to-date.
Contributors
On a relative basis, stock selection in the Health Care sector and no exposure to the Consumer Staples and Energy sectors were among the primary contributors to performance.
Broadcom, Applied Materials and McKesson were amongst the largest contributors to performance on an absolute basis.
Broadcom and Applied Materials continue to benefit from the significant investments in Artificial Intelligence and the resulting strong demand for chips
McKesson continues to benefit from an attractive valuation in our opinion and execution against its strategic plan.
Detractors
On a relative basis, in addition to not owning Nvidia (which doesn’t meet our criteria for high dividend growth), stock selection in the Information Technology sector, the overweight and stock selection in Materials and Financials were among the primary detractors.
Sherwin Williams, Lowe’s and MSCI were amongst the largest detractors on an absolute basis.
Sherwin-Williams stock underperformed after the company delivered lower first-quarter earnings and revenue than expected as demand in their DIY-segment was softer than anticipated.
Lowe’s underperformed despite strong quarterly results that saw the company beat estimates for both revenue and earnings as an anticipated decline in same store sales was better than feared. Softer “do-it-yourself” big ticket spending was partially offset by strength in the Pro segment as well as in online sales, and we were pleased to see the company took share in the important Pro segment this quarter.
MSCI’s stock price declined during the period on concerns about lower subscription revenue growth, higher expenses and lower net recurring revenue across segments. The lower subscription revenue was due to elevated cancellations and lower retention but were mostly due to client merger activity and the resulting downsizing for shutting funds. Excluding this, retention was 94% vs the 92.8% reported. Our view is that stock price reaction is an overreaction to short term issues and the long-term secular tailwinds driven by transparency and measurement between assets owners and asset managers remain firmly intact.
Transactions
During the quarter, our investments in Allegion plc and Roper Technologies Inc. were sold, both primarily due to lower dividend growth.
We initiated new investments in GE Aerospace (GE) and Old Dominion Freight Line Inc (ODFL). We are confident that both companies will increase their dividends at high rates in the near term.
GE Aerospace is a global aerospace propulsion, services, and systems leader, operating in an oligopolistic industry with high barriers to entry. Strong partnerships with major aircraft manufacturers like Boeing and Airbus ensure a steady demand for GE engines. In addition, approximately 70% of GE Aerospace’s revenue comes from services, providing a stable and resilient income stream. In addition, GE’s proprietary lean operating model, has led to significant operational improvements which we believe will help management achieve their goal of returning 70%-75% of available free cash flow to shareholders through dividends and buybacks.
ODFL is the second largest North American less-than-truckload (“LTL”) motor carriers, providing regional, inter-regional and national LTL services through a single integrated, union-free organization. Servicing a growing and consolidating market, ODFL operates in an industry that has high barriers to entry due to the hub and spoke nature of its distribution system. We believe the company is the best-in-class operator with an industry leading operating ratio and a strong history of returning capital to shareholders. ODFL’s attractive revenue growth, low operating ratio, strong free cash flow generation, high returns on invested capital, and steady stream of reinvestment opportunities have fueled stock returns historically.
As per our quarterly rebalancing process, we reduced our investments in Applied Materials Inc., Cintas Inc., and Broadcom Inc. We reinvested the proceeds into MSCI Inc., Corteva Inc., Zoetis Inc., and UnitedHealth Group.
Outlook
We continue to experience a very bifurcated market, led by the Magnificent 7. While these companies continue to post impressive results, the law of large numbers will increasingly challenge growth going forward. We believe the bar is set much lower for other areas of the market where valuations and growth expectations are more reasonable, if not conservative, and continue to seek opportunities in those areas.
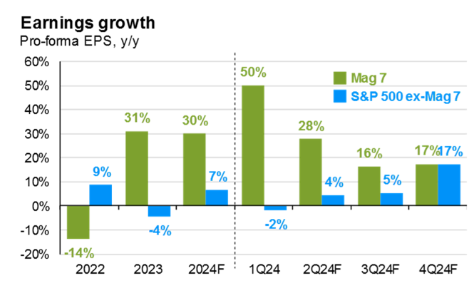
Source: JPMorgan Guide to the Markets, June 30, 2024.
The benefit of having a disciplined investment process is that it allows you to weather periods like this whenever they arise and to focus on what has allowed us to achieve successful outcomes for our clients for 15 years, which is owning a concentrated portfolio of high quality, high dividend growth stocks. Dividend strategies have struggled in the current environment from a relative performance perspective:
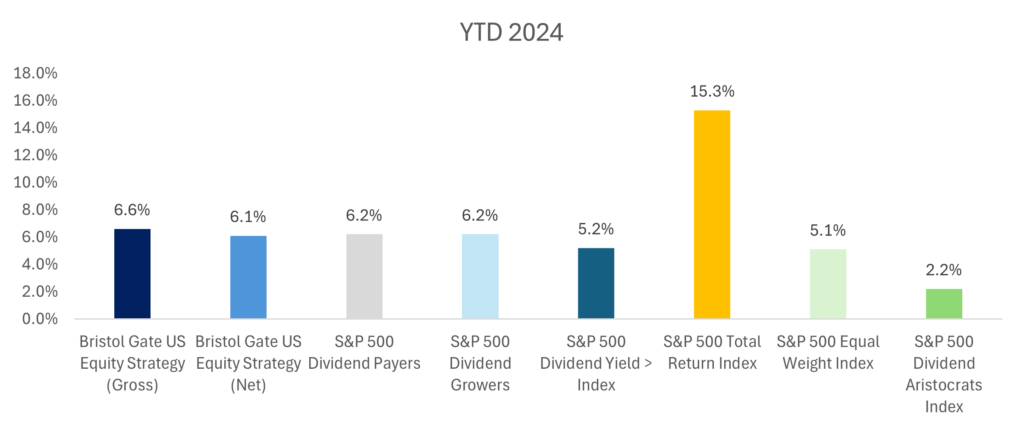
Source: Bristol Gate Capital Partners, Morningstar, Bloomberg. As at June 30, 2024. There is a risk of loss inherent in any investment; past performance is not indicative of future results. Please see important disclosures at end of document.
We know that these periods do not last forever. Eventually, fundamentals matter, and we continue to focus on them. Nine portfolio companies have announced dividend increases this year averaging in excess of 13%. From the perspective of their operating results, we continue to see the quality of the portfolio come through. Our holdings have delivered median ~10% revenue growth and ~8% earnings growth, both superior to that of the broad market. Over the long-term, we believe those fundamentals and our approach will be rewarded.
Source: Bristol Gate Capital Partners. There is a risk of loss inherent in any investment; past performance is not indicative of future results. Please see important disclosures at end of document.
Canadian Equity Strategy
Market Recap
The S&P/TSX Composite declined by 0.5% during the second quarter. The Telecom, Information Technology and Real Estate sectors all experienced a negative return as the Canadian economy remains challenged. The Bank of Canada cut its policy interest rate in June for the first time since halting the hiking cycle in mid-2023 in an attempt to boost growth.
Portfolio Results
The Canadian Equity strategy outperformed the index during the quarter.
Contributors
On a relative basis, stock selection in the Consumer Discretionary, Industrials and Financials sectors were the primary contributors to returns.
Dollarama, Stella-Jones and Element Fleet Financial were amongst the largest contributors to performance on an absolute basis.
Dollarama continues to deliver strong top and bottom-line growth. The firm also announced they increased their stake in Latin American retailer Dollarcity to over 60%.
Stella-Jones’s full year results demonstrated that despite normalization on pole volumes, their ability to raise prices remains strong. The ties segment also outperformed expectations both in volumes and price. All this resulted in much better than estimated operating margins and strong year over year earnings growth.
Element Fleet also outperformed after posting strong results, reaching all-time highs in revenues and issuing strong guidance
Detractors
On a relative basis, the overweight and stock selection in Real Estate, stock selection in Information Technology and a lack of exposure to the Energy sector detracted from returns in the quarter.
Open Text, InterRent Real Estate Investment Trust and Canadian National Railway were amongst the largest detractors on an absolute basis.
Open Text experienced a significant share decline when they reported their quarterly results that raised concerns around the rate at which they are transitioning their customers from on-premise to their cloud offerings and the capital expenditures that may be required to achieve their goals. The positive takeaway was that demand is there and the earlier than expected close of its disposition of AMC lowered the company’s leverage levels to management’s target rate, allowing for a capital allocation model of 50% towards buybacks and dividends and 50% towards cloud M&A. We continue to watch how the business progresses against our thesis and follow our process.
InterRent and the broader residential real estate names underperformed this quarter despite the move from the Bank of Canada to initiate a rate cut cycle, a positive event for the sector in general. The underperformance happened despite a still favorable market environment with a significant shortage of housing in many of the areas that the company is operating. The moves from government to stem the record-breaking immigration flows of the past few years were partly responsible, however it will take some time to see an actual decrease in the population growth and will not materially change the residential real estate market’s supply and demand dynamics for the foreseeable future. We continue to monitor the operating results the company is delivering against all of this.
Canadian National Railway, and therefore the fund’s exposure to the rails, was for the quarter one of the largest detractors on an absolute basis, but after the sale of Canadian Pacific Kansas City, the fund is at an underweight on the rails exposure versus the index and therefore it ended up as a positive from a relative attribution standpoint. Freight uncertainty and some operational challenges for Canadian National Railway contributed to its negative performance but we consider the issues to be temporary and at current valuations are excited at the prospect to potentially add to our investment through our rebalancing process.
Transactions
During the quarter, we exited our investment in Visa and initiated a new position in Broadcom Inc. The change was primarily our view that there is more upside in Broadcom from a valuation perspective for similar levels of dividend growth as Visa and that Broadcom represents a scarcer opportunity relative to the Canadian landscape which has a dearth of opportunities to the AI theme.
As per our quarterly rebalancing process, we reduced our investments in Dollarama, Stella Jones and Thomson Reuters and increased our investments in Canadian National Railway, Colliers International, Zoetis, Open Text and InterRent Real Estate Investment Trust.
Source: Bristol Gate Capital Partners. There is a risk of loss inherent in any investment; past performance is not indicative of future results. Please see important disclosures at end of document.
Firm Update
To all our clients:
We are happy to announce that Youssef Rofail joined Bristol Gate in June as Operations Analyst. In addition, Laura Hall will be taking on the new role of Relationship Manager. Youssef’s addition and Laura’s new role will strengthen our ability to continue to serve our clients to the best of our abilities.
Thank you for your ongoing support and trust. We are determined to do everything we can to provide you income growth and strong investment returns in the future.
Sincerely,
The Bristol Gate Team
Important disclosures
There is a risk of loss inherent in any investment; past performance is not indicative of future results. Prospective and existing investors in Bristol Gate’s pooled funds or ETF funds should refer to the fund’s offering documents which outline the risk factors associated with a decision to invest. Separately managed account clients should refer to disclosure documents provided which outline risks of investing. Pursuant to SEC regulations, a description of risks associated with Bristol Gate’s strategies is also contained in Bristol Gate’s Form ADV Part 2A located at www.bristolgate.com/regulatory-documents.
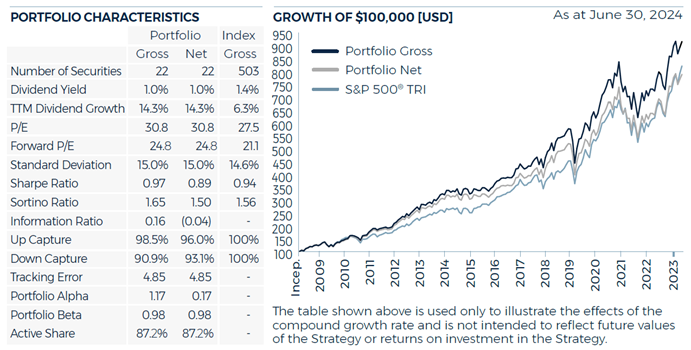
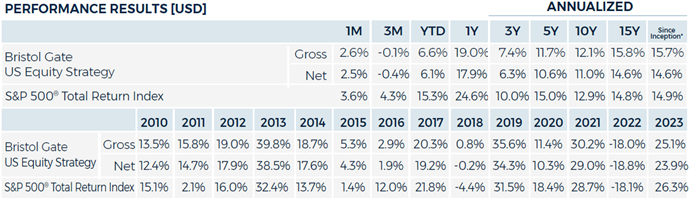
US Equity Strategy returns in this report refer to the Bristol Gate US Equity Strategy Composite (the “Composite”). The Composite consists of equities of publicly traded, dividend paying US companies. The Composite is valued in US Dollars and for comparison purposes is measured against the S&P 500 Total Return Index. The composite’s Investment Advisor, Bristol Gate Capital Partners Inc., defines itself as a portfolio manager, exempt market dealer and investment fund manager (as per its registration in Ontario, its principal regulator in Canada) and is also a Registered Investment Adviser with the U.S. Securities and Exchange Commission (the “SEC”). The Investment Advisor’s objective is to select companies with positive dividend growth, and which collectively will generate over the long term a growing income and capital appreciation for investors. The inception date of the Composite is May 15, 2009. The US Dollar is the currency used to measure performance, which is presented on a gross and net basis and includes the reinvestment of investment income. The composite’s gross return is gross of withholding tax prior to January 1, 2017 and is net of withholding tax thereafter. Net returns are calculated by reducing the gross returns by the maximum management fee charged by Bristol Gate of 1%, applied monthly. Actual investment advisory fees incurred by clients may vary. There is the opportunity for the use of leverage up to 30% of the net asset value of the underlying investments using a margin account at the prime broker. Thus far no material leverage has been utilized. An investor’s actual returns may be reduced by management fees, performance fees, and other operating expenses that may be incurred because of the management of the composite. A performance fee may also be charged on some accounts and funds managed by the firm. Bristol Gate claims compliance with the Global Investment Performance Standards (GIPS®). GIPS® is a registered trademark of CFA Institute. CFA Institute does not endorse or promote this organization, nor does it warrant the accuracy or quality of the content contained herein. To obtain a GIPS Composite Report, please email us at info@bristolgate.com.
The S&P 500® Total Return Index measures the performance of the broad US equity market, including dividend re-investment, in US dollars. This index is provided for information only and comparisons to the index has limitations. The benchmark is an appropriate standard against which the performance of the strategy can be measured over longer time periods as it represents the primary investment universe from which Bristol Gate selects securities. However, Bristol Gate’s portfolio construction process differs materially from that of the benchmark and the securities selected for inclusion in the strategy are not influenced by the composition of the benchmark. For example, the strategy is a concentrated portfolio of approximately equally weighted dividend-paying equity securities, rebalanced quarterly whereas the benchmark is a broad stock index (including both dividend and non-dividend paying equities) that is market capitalization weighted. As such, strategy performance deviations relative to the benchmark may be significant, particularly over shorter time periods. The strategy has concentrated investments in a limited number of companies; as a result, a change in one security’s value may have a more significant effect on the strategy’s value.
In addition to strategy’s benchmark described above, the following additional Index data may be presented for information purposes only and comparisons to these Indices has limitations:
The S&P 500® Equal Weight Index (EWI) is the equal-weight version of the widely-used S&P 500. The index includes the same constituents as the capitalization weighted S&P 500, but each company in the S&P 500 EWI is allocated a fixed weight – or 0.2% of the index total at each quarterly rebalance. The index is used to highlight the impact of concentration in the market cap weighted index but is of limited in relevance as it not solely focus on dividend paying securities, whereas Bristol Gate’s US Equity strategy’s securities solely are focused on dividend paying securities.
S&P 500 ® Total Return Dividend Aristocrats Index measures the performance of a subset of S&P 500® Index companies that have increased their dividends every year for the last 25 consecutive years. This Index has limited relevancy to our approach as it focuses on historical dividend growth, whereas Bristol Gate’s US Equity strategy’s securities are selected based on future dividend growth.
SPDR® S&P 500® ETF Trust (SPY US) sourced from Bloomberg has been used as a proxy for the S&P 500® Total Return Index for the purpose of providing non-return-based portfolio statistics and sector weightings in this report. SPY US is an ETF that seeks to provide investment results that, before expenses, correspond generally to the price and yield performance of the S&P 500® Index.
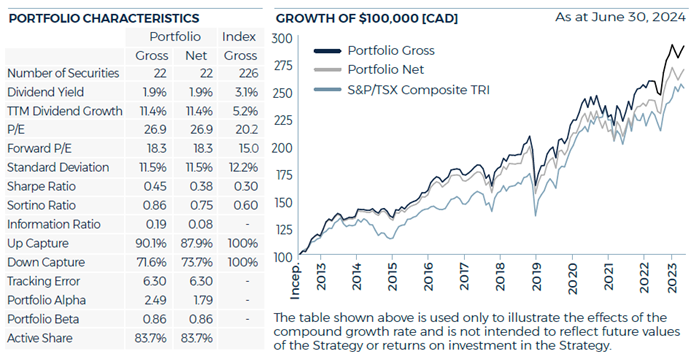
Canadian Equity Strategy returns in this report refer to the Bristol Gate Canadian Equity Strategy Composite (the “Composite”). The Composite consists primarily of equities of publicly traded, dividend paying Canadian companies.
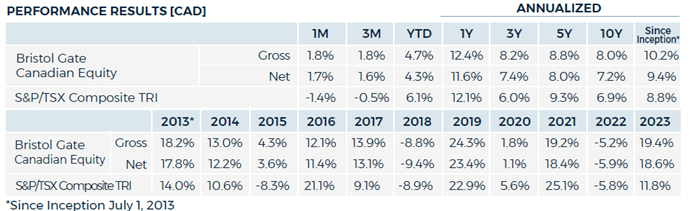
The Composite is valued in Canadian Dollars and for comparison purposes is measured against the S&P/TSX. The composite’s Investment Advisor, Bristol Gate Capital Partners Inc., defines itself as a portfolio manager, exempt market dealer and investment fund manager (as per its registration in Ontario, its principal regulator in Canada) and is also a Registered Investment Adviser with the U.S. Securities and Exchange Commission (the “SEC”). The Investment Advisor’s objective is to select companies primarily from the S&P/TSX universe with positive dividend growth and which collectively will generate over the long term a growing income and capital appreciation for investors. The inception date of the Composite is July 1, 2013. Returns are presented gross and net of fees and include the reinvestment of all income. The composite’s gross return is gross of withholding tax prior to January 1, 2017 and is net of withholding tax thereafter. Net returns are calculated by reducing the gross returns by the maximum management fee charged by Bristol Gate of 0.7%, applied monthly. Actual investment advisory fees incurred by clients may vary. An investor’s actual returns may be reduced by management fees, performance fees, and other operating expenses that may be incurred because of the management of the composite. A performance fee may be charged on some accounts and funds managed by the firm. Bristol Gate claims compliance with the Global Investment Performance Standards (GIPS®). GIPS® is a registered trademark of CFA Institute. CFA Institute does not endorse or promote this organization, nor does it warrant the accuracy or quality of the content contained herein. To obtain a GIPS Composite Report, please email us at info@bristolgate.com.
The returns have been converted into Canadian Dollars using month‐end Bank of Canada Closing rates.
The S&P/TSX Total Return Index measures the performance of the broad Canadian equity market, including dividend re-investment, in Canadian dollars. This index has been provided for information only and comparisons to the index has limitations. The benchmark is an appropriate standard against which the performance of the strategy can be measured over longer time periods as it represents the primary investment universe from which Bristol Gate selects securities. However, Bristol Gate’s portfolio construction process differs materially from that of the benchmark and the securities selected for inclusion in the strategy are not influenced by the composition of the benchmark. For example, the strategy is a concentrated portfolio of approximately equally weighted dividend-paying equity securities, rebalanced quarterly whereas the benchmark is a broad stock index (including both dividend and non-dividend paying equities) that is market capitalization weighted. As such, strategy performance deviations relative to the benchmark may be significant, particularly over shorter time periods. The strategy has concentrated investments in a limited number of companies; as a result, a change in one security’s value may have a more significant effect on the strategy’s value.
iShares Core S&P®/TSX® Capped Composite Index ETF (XIC CN) sourced from Bloomberg has been used as a proxy for the S&P®/TSX® Total Return Index for the purpose of providing non-return-based portfolio statistics and sector weightings in this report. XIC CN is an ETF that seeks long-term capital growth by replicating the performance of the S&P®/TSX® Capped Composite Index, net of expenses.
This Report is for information purposes and should not be construed under any circumstances as a public offering of securities in any jurisdiction in which an offer or solicitation is not authorized. Prospective investors in Bristol Gate’s pooled funds or ETF funds should rely solely on the fund’s offering documents, which outline the risk factors associated with a decision to invest. No representations or warranties of any kind are intended or should be inferred with respect to the economic return or the tax implications of any investment in a Bristol Gate fund.
This piece is presented for illustrative and discussion purposes only. It should not be considered as personal investment advice or an offer or solicitation to buy and/or sell securities and it does not consider unique objectives, constraints, or financial needs of the individual. Under no circumstances does this piece suggest that you should time the market in any way or make investment decisions based on the content. Investors are advised that their investments are not guaranteed, their values change frequently, and past performance may not be repeated. References to specific securities are presented to illustrate the application of our investment philosophy only, do not represent all of the securities purchased, sold or recommended for the portfolio, and it should not be assumed that investments in the securities identified were or will be profitable and should not be considered recommendations by Bristol Gate Capital Partners Inc. A full list of security holdings is available upon request. For more information contact Bristol Gate Capital Partners Inc. directly. The information contained in this piece is the opinion of Bristol Gate Capital Partners Inc. and/or its employees as of the date of the piece and is subject to change without notice. Every effort has been made to ensure accuracy in this piece at the time of publication; however, accuracy cannot be guaranteed. Market conditions may change and Bristol Gate Capital Partners Inc. accepts no responsibility for individual investment decisions arising from the use of or reliance on the information contained herein. We strongly recommend you consult with a financial advisor prior to making any investment decisions. Please refer to the Legal section of Bristol Gate’s website for additional information at bristolgate.com.
A Note About Forward-Looking Statements
This report may contain forward-looking statements including, but not limited to, statements about the Bristol Gate strategies, risks, expected performance and condition. Forward-looking statements include statements that are predictive in nature, that depend upon or refer to future events and conditions or include words such as “may”, “could”, “would”, “should”, “expect”, “anticipate”, “intend”, “plan”, “believe”, “estimate” and similar forward-looking expressions or negative versions thereof.
These forward-looking statements are subject to various risks, uncertainties and assumptions about the investment strategies, capital markets and economic factors, which could cause actual financial performance and expectations to differ materially from the anticipated performance or other expectations expressed. Economic factors include, but are not limited to, general economic, political and market factors in North America and internationally, interest and foreign exchange rates, global equity and capital markets, business competition, technological change, changes in government regulations, unexpected judicial or regulatory proceedings, and catastrophic events.
Readers are cautioned not to place undue reliance on forward-looking statements and consider the above-mentioned factors and other factors carefully before making any investment decisions. All opinions contained in forward-looking statements are subject to change without notice and are provided in good faith. Forward-looking statements are not guarantees of future performance, and actual results could differ materially from those expressed or implied in any forward-looking statements. Bristol Gate Capital Partners Inc. has no specific intention of updating any forward-looking statements whether as a result of new information, future events or otherwise, except as required by securities legislation.
 Takes 2 minutes