
October 18, 2024
Performance Summary
During the quarter, both the US Equity and Canadian Equity Strategies outperformed their respective benchmarks and continue to outpace the indices in terms of dividend growth. For a more detailed discussion on performance see each Strategy’s respective section below.
Portfolio Dividend Growth – Trailing and consensus forward 12 months.
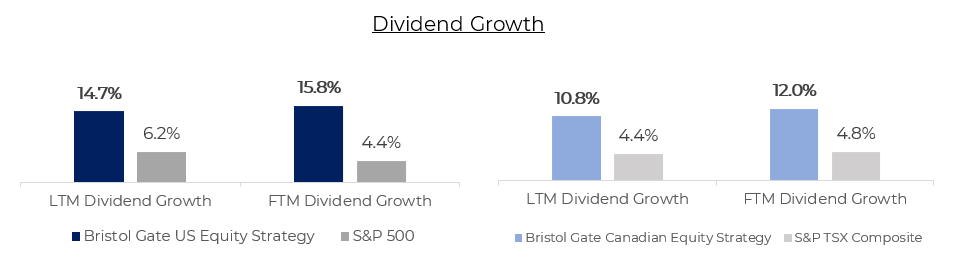
Note: Last 12 months (“LTM”) Dividend Growth is the median of the actual trailing 12-month dividend growth of the individual stocks held by Strategies or Index constituents as reported by Bloomberg as at Sept 30, 2024. Forward 12 months (“FTM”) Dividend Growth is the median of the Bristol Gate Model’s forward 12-month prediction for the individual stocks held by the Strategies and the median of consensus estimates for the constituents of the Indices as of quarter end. Companies without a consensus dividend forecast were excluded.
Source: Bloomberg, FactSet, Bristol Gate Capital Partners.
US Equity Strategy
Market Recap
The S&P 500 Index experienced its fourth consecutive quarter of gains, rising by more than 5% during Q3 2024. This strong performance occurred at the onset of a new interest rate easing cycle by the Federal Reserve, which implemented a significant rate cut of 50 basis points in September to support growth and stabilize a slowing labour market. This marked the first easing decision since the onset of the COVID-19 pandemic. The cut, coupled with the central bank’s signaling of further rate reductions, if necessary, generated optimism among investors. Additionally, positive market sentiment was bolstered by strong corporate earnings in the second quarter, which surpassed initial estimates.
Portfolio Results
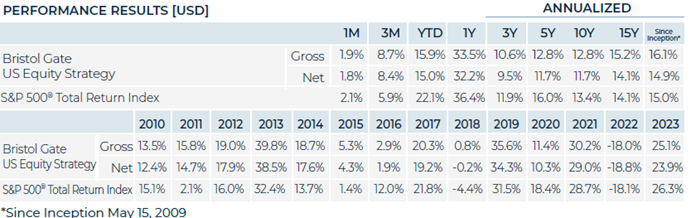
The US Equity strategy outperformed the benchmark in the period.
Contributors
An overweight position and strong stock selection in Industrials, along with an overweight to Materials and Financials, contributed positively to returns in the period.
On an absolute basis, Sherwin-Williams Co., Carrier Global Corp., and Lowes Inc. were amongst our best performers in the period.
Sherwin-Williams outperformed after posting strong quarterly results and raising their full-year guidance for earnings. The company also held its annual Investor Day in September, highlighting market share gains and productivity improvements during an unfavourable macro environment. Carrier continued to execute along its strategy to become a pure play HVAC company, announcing the sale of its Commercial & Residential Fire business to private equity. Divesting this segment was the last piece of Carrier’s portfolio transformation. Together, with the completed exits of their Industrial Fire and Global Access Solutions business lines and the pending sale of their Commercial Refrigeration unit, Carrier’s four exits total over $10B in value and ~$7.7B in net proceeds, $1-2B higher than our initial expectations when we acquired the shares approximately one year ago. Lowe’s benefited from improved investor sentiment brought by lower interest rates and the implications of that on the housing market.
Detractors
Stock selection in the Information Technology sector detracted from returns in the period. Additionally, the allocation effect in Staples, Utilities and Real Estate sectors detracted from performance. Our strategy is typically underweight these sectors as they offer fewer opportunities to source high dividend growth than others. However, their higher yields attract investors during the onset or rate cutting cycles as we are experiencing today, and they tend to perform well on a relative basis during such periods.
On an absolute basis, McKesson Corp., Applied Materials Inc., and Microchip Technology Inc. were amongst our weakest performers in the period.
McKesson lagged the market after comments from management regarding its fiscal Q2 2025 earnings expectations which were more muted than consensus was expecting. We believe Applied Materials’ decline was largely driven by the headwinds of investors rotating out of the “AI trade” and into other areas of the market. In August, Microchip reported quarterly results that continued to reflect excess customer inventory reductions brought by a slowing economy. We believe we are near the end of the destocking cycle and believe Microchip is well positioned for a potential recovery. We have no long-term fundamental concerns regarding any of these holdings.
Outlook
For some time, we and others have been highlighting the concentrated nature of the Index’s returns. At the end of the second quarter, we asked:
- How sustainable is the growth being priced into the “Magnificent Seven”; and
- Are the other 493 companies being appropriately valued if a broad recovery in earnings growth materializes?
Deviating from the Index when concentration was high had historically been a good strategy, and we believed this time would be no different. As shown in Exhibit 1, only about a quarter of the companies in the S&P 500 were outperforming the Index on a year-to-date basis at the end of June. That was significantly below the 47% average between 2010 (the first full year of our US strategy) and 2023. The S&P 500 finally caught its “breadth” in the third quarter with a reversal of the concentration that characterized its returns for the prior year and a half. The percentage of companies in the S&P 500 outperforming the Index improved to 40% on a year-to-date basis with approximately two-thirds of the constituents doing so in Q3 alone.
Exhibit 1. Percentage of S&P 500 Constituents Outperforming the Index
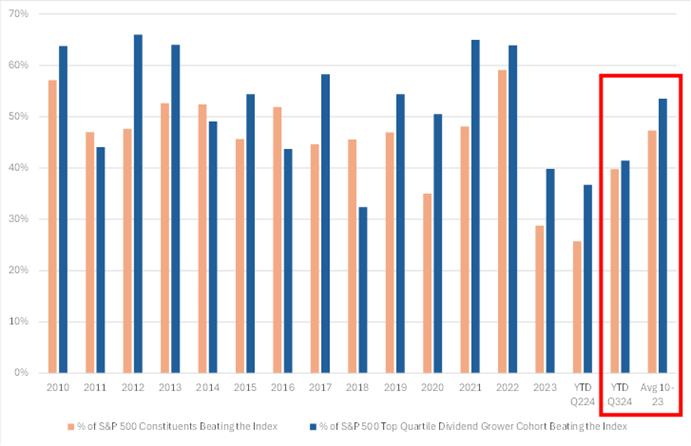
Note: Dividend growth is calculated on a trailing 12-month basis and includes special dividends. Dividend initiators are excluded as these render growth calculations meaningless. The population to determine quartile rankings include all dividend payers (dividend growers, maintainers, and cutters) but exclude initiators. Source: Bloomberg, Bristol Gate Capital Partners.
More relevant to our focus universe, high dividend growers also had a period of abnormal underperformance relative to the Index in the first half of the year. On average, between 2010 and 2023, 54% of the fast dividend growers outperformed the index. As at the end of Q2 2024, 37% of the high dividend growth universe was outperforming the S&P500. By the end of Q3, this number improved to 41%.
Market concentration has had an obvious impact on relative returns. That improvement in market breadth helped us outperform the Index during Q3. But where do we go from here?
At Bristol Gate, we can’t control the index or the economy, and we don’t try to. What we can do is seek to consistently deliver a portfolio of high quality, high dividend growers by owning companies that are confident in their free cash flow growth and prospects looking forward. Reversals can, and do, happen quickly, as we saw in July, and it is important for us to always focus on our process and the fundamentals of the companies we own.
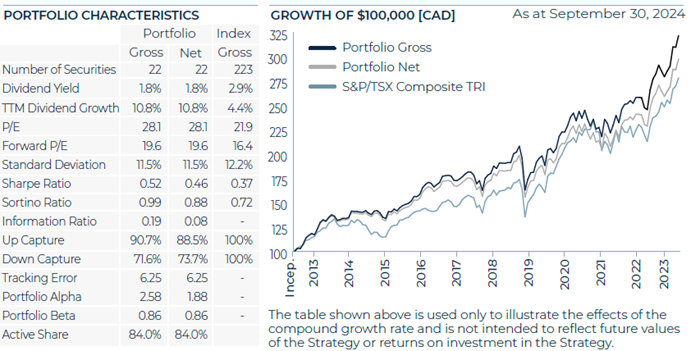
When we look at our portfolio, we see sustainable tailwinds that are helping drive earnings growth, free cash flow growth, and subsequently dividend growth to us as shareholders. This year, 17 of our 22 portfolio companies have already announced dividend increases averaging ~13%, backed up by our portfolio’s earnings and revenue growth of ~12% and ~6%, respectively. We believe consistently generating results such as these will lead to attractive returns over time.
As investor attention turns away from the “Magnificent Seven” with the Index’s earnings growth increasingly driven by the remaining 493 constituents, we believe our high dividend growth universe represents an attractive investment opportunity. Even with the relative improvement our universe experienced in Q3, we remain far below the average percentage of outperformers versus the Index. In the meantime, through portfolio construction, we seek to limit risk and ensure that each of our 22 names maintains an adequate weighting to help drive returns for investors. By staying consistent, we aim to continue to deliver for clients over time.
Source: Bristol Gate Capital Partners. There is a risk of loss inherent in any investment; past performance is not indicative of future results. Please see important disclosures at end of document.
Canadian Equity Strategy
Market Recap
The S&P/TSX Composite Index rose over 10% in the quarter. As economic growth slowed, the Bank of Canada to continued to cut interest rates, which benefited interest-rate sensitive sectors, including Financials, Real Estate and Utilities.
Portfolio Results
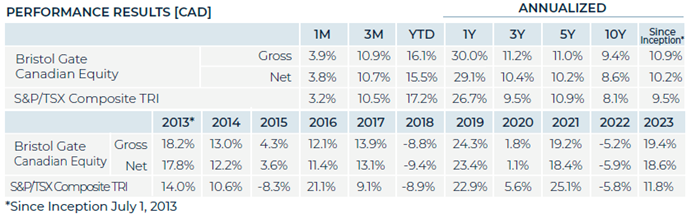
The Canadian Equity strategy outperformed the index during the quarter.
Contributors
An overweight to Real Estate and strong stock selection within Consumer Discretionary contributed positively to returns. Additionally, having no exposure to Energy also added to the performance during the period.
On an absolute basis, Colliers International Group, Brookfield Corp., and Jamieson Wellness were amongst our best performers in the period. Colliers performed well as management raised their full-year guidance to account for their acquisition of Englobe. Brookfield Corp. outperformed given the tailwind of falling interest rates. Jamieson outpaced the market as the company posted results that modestly outperformed expectations.
Detractors
Stock selection in the Materials and Information Technology sectors detracted from returns in the period. Additionally, being underweight Financials negatively impacted performance.
On an absolute basis, Alimentation Couche-Tard Inc., Canadian National Railway Co., and Stella-Jones Inc. were amongst our weakest performers in the period. Couche-Tard lagged on speculation of the impact of a potential acquisition of 7-Eleven. CN Rail trailed the index as management slightly lowered their full-year guidance. Stella-Jones underperformed despite continuing to execute well from an operational perspective. We have no long-term fundamental concerns about any of these companies.
Outlook
In a challenging year for the Canadian economy, the market continued to deliver strong absolute returns, which serves as the latest reminder that the market is not the economy.
Our portfolio companies continue to deliver strong fundamental results, as evidenced by their latest quarterly results. 15 portfolio companies have announced dividend increases in 2024, averaging over 12%, and the portfolio in aggregate has a median of ~9% revenue growth and ~13% EPS growth, which compares favourably to the S&P/TSX’s broad results (~13% EPS growth, ~7% revenue growth).
We continue to focus on the companies we own and evaluate potential new holdings that are identified as high dividend growers by our machine learning model. By continuing to stick to our process, we are confident we will continue to be able to navigate whatever comes our way via the economy or markets in both the near and long-term.
Source: Bristol Gate Capital Partners. There is a risk of loss inherent in any investment; past performance is not indicative of future results. Please see important disclosures at end of document.
Firm Update
To all our clients:
Over the past few months, we have been successful in establishing new relationships which will provide future growth for our firm. This is a testament to the fact that there will always be demand for a unique, evidence-based investment approach that provides investors with additional income every year.
As we expand our business it is important that we maintain the highest level of client care. To help manage this, we would like to welcome Elizabeth O’Sullivan to the firm, who joins Bristol Gate as a Relationship Manager.
To all our clients, thank you for your ongoing support and trust. We are determined to do everything we can to provide you income growth and strong investment returns in the future.
Yours sincerely,
The Bristol Gate Team
Important disclosures
There is a risk of loss inherent in any investment; past performance is not indicative of future results. Prospective and existing investors in Bristol Gate’s pooled funds or ETF funds should refer to the fund’s offering documents which outline the risk factors associated with a decision to invest. Separately managed account clients should refer to disclosure documents provided which outline risks of investing. Pursuant to SEC regulations, a description of risks associated with Bristol Gate’s strategies is also contained in Bristol Gate’s Form ADV Part 2A located at www.bristolgate.com/regulatory-documents.
The information contained herein is obtained from multiple sources that are believed to be reliable. However, such information may not have been verified, and may be different from the information included in documents and materials created by a sponsor firm in whose investment program a client participates. Some sponsor firms may require that these Bristol Gate materials are preceded or accompanied by investment profiles or other documents or materials prepared by such sponsor firms, which will be provided upon a client’s request. There may be discrepancies between Bristol Gate’s performance returns and the returns included in a sponsor firm’s profile document (for example, but not limited to, differences in account size/type, portfolio management strategies, the number of securities held, average account size, inclusion of institutional or mutual fund accounts, etc.) For additional information, documents and/or materials, please speak to your Financial Advisor.
US Equity Strategy returns in this report refer to the Bristol Gate US Equity Strategy Composite (the “US Composite”). The US Composite consists of equities of publicly traded, dividend paying US companies. The US Composite is valued in US Dollars and for comparison purposes is measured against the S&P 500 Total Return Index. The US Composite’s Investment Advisor, Bristol Gate Capital Partners Inc., defines itself as a portfolio manager, exempt market dealer and investment fund manager (as per its registration in Ontario, its principal regulator in Canada) and is also a Registered Investment Adviser with the U.S. Securities and Exchange Commission (the “SEC”). The Investment Advisor’s objective is to select companies with positive dividend growth, and which collectively will generate over the long term a growing income and capital appreciation for investors. The inception date of the US Composite is May 15, 2009. The US Dollar is the currency used to measure performance, which is presented on a gross and net basis and includes the reinvestment of investment income. The US Composite’s gross return is gross of withholding tax prior to January 1, 2017 and is net of withholding tax thereafter. Net returns are calculated by reducing the gross returns by the maximum management fee charged by Bristol Gate of 1%, applied monthly. Actual investment advisory fees incurred by clients may vary. There is the opportunity for the use of leverage up to 30% of the net asset value of the underlying investments using a margin account at the prime broker. Thus far no material leverage has been utilized. An investor’s actual returns may be reduced by management fees, performance fees, and other operating expenses that may be incurred because of the management of the US Composite. A performance fee may also be charged on some accounts and funds managed by the firm. Bristol Gate claims compliance with the Global Investment Performance Standards (GIPS®). GIPS® is a registered trademark of CFA Institute. CFA Institute does not endorse or promote this organization, nor does it warrant the accuracy or quality of the content contained herein. To obtain a GIPS Composite Report, please email us at info@bristolgate.com.
The S&P 500® Total Return Index measures the performance of the broad US equity market, including dividend re-investment, in US dollars. This index is provided for information only and comparisons to the index has limitations. The benchmark is an appropriate standard against which the performance of the strategy can be measured over longer time periods as it represents the primary investment universe from which Bristol Gate selects securities. However, Bristol Gate’s portfolio construction process differs materially from that of the benchmark and the securities selected for inclusion in the strategy are not influenced by the composition of the benchmark. For example, the strategy is a concentrated portfolio of approximately equally weighted dividend-paying equity securities, rebalanced quarterly whereas the benchmark is a broad stock index (including both dividend and non-dividend paying equities) that is market capitalization weighted. As such, strategy performance deviations relative to the benchmark may be significant, particularly over shorter time periods. The strategy has concentrated investments in a limited number of companies; as a result, a change in one security’s value may have a more significant effect on the strategy’s value.
SPDR® S&P 500® ETF Trust (SPY US) sourced from Bloomberg has been used as a proxy for the S&P 500® Total Return Index for the purpose of providing non-return-based portfolio statistics and sector weightings in this report. SPY US is an ETF that seeks to provide investment results that, before expenses, correspond generally to the price and yield performance of the S&P 500® Index.
Canadian Equity Strategy returns in this report refer to the Bristol Gate Canadian Equity Strategy Composite (the “Canadian Composite”). The Canadian Composite consists primarily of equities of publicly traded, dividend paying Canadian companies. The Canadian Composite is valued in Canadian Dollars and for comparison purposes is measured against the S&P/TSX. The Canadian Composite’s Investment Advisor, Bristol Gate Capital Partners Inc., defines itself as a portfolio manager, exempt market dealer and investment fund manager (as per its registration in Ontario, its principal regulator in Canada) and is also a Registered Investment Adviser with the U.S. Securities and Exchange Commission (the “SEC”). The Investment Advisor’s objective is to select companies primarily from the S&P/TSX universe with positive dividend growth and which collectively will generate over the long term a growing income and capital appreciation for investors. The inception date of the Canadian Composite is July 1, 2013. Returns are presented gross and net of fees and include the reinvestment of all income. The Canadian composite’s gross return is gross of withholding tax prior to January 1, 2017 and is net of withholding tax thereafter. Net returns are calculated by reducing the gross returns by the maximum management fee charged by Bristol Gate of 0.7%, applied monthly. Actual investment advisory fees incurred by clients may vary. An investor’s actual returns may be reduced by management fees, performance fees, and other operating expenses that may be incurred because of the management of the Canadian Composite. A performance fee may be charged on some accounts and funds managed by the firm. Bristol Gate claims compliance with the Global Investment Performance Standards (GIPS®). GIPS® is a registered trademark of CFA Institute. CFA Institute does not endorse or promote this organization, nor does it warrant the accuracy or quality of the content contained herein. To obtain a GIPS Composite Report, please email us at info@bristolgate.com.
The returns have been converted into Canadian Dollars using month‐end Bank of Canada Closing rates.
The S&P/TSX Total Return Index measures the performance of the broad Canadian equity market, including dividend re-investment, in Canadian dollars. This index has been provided for information only and comparisons to the index has limitations. The benchmark is an appropriate standard against which the performance of the strategy can be measured over longer time periods as it represents the primary investment universe from which Bristol Gate selects securities. However, Bristol Gate’s portfolio construction process differs materially from that of the benchmark and the securities selected for inclusion in the strategy are not influenced by the composition of the benchmark. For example, the strategy is a concentrated portfolio of approximately equally weighted dividend-paying equity securities, rebalanced quarterly whereas the benchmark is a broad stock index (including both dividend and non-dividend paying equities) that is market capitalization weighted. As such, strategy performance deviations relative to the benchmark may be significant, particularly over shorter time periods. The strategy has concentrated investments in a limited number of companies; as a result, a change in one security’s value may have a more significant effect on the strategy’s value.
This Report is for information purposes and should not be construed under any circumstances as a public offering of securities in any jurisdiction in which an offer or solicitation is not authorized. Prospective investors in Bristol Gate’s pooled funds or ETF funds should rely solely on the fund’s offering documents, which outline the risk factors associated with a decision to invest. No representations or warranties of any kind are intended or should be inferred with respect to the economic return or the tax implications of any investment in a Bristol Gate fund.
This piece is presented for illustrative and discussion purposes only. It should not be considered as personal investment advice or an offer or solicitation to buy and/or sell securities and it does not consider unique objectives, constraints, or financial needs of the individual. Under no circumstances does this piece suggest that you should time the market in any way or make investment decisions based on the content. Investors are advised that their investments are not guaranteed, their values change frequently, and past performance may not be repeated. References to specific securities are presented to illustrate the application of our investment philosophy only, do not represent all of the securities purchased, sold or recommended for the portfolio, and it should not be assumed that investments in the securities identified were or will be profitable and should not be considered recommendations by Bristol Gate Capital Partners Inc. A full list of security holdings is available upon request. For more information contact Bristol Gate Capital Partners Inc. directly. The information contained in this piece is the opinion of Bristol Gate Capital Partners Inc. and/or its employees as of the date of the piece and is subject to change without notice. Every effort has been made to ensure accuracy in this piece at the time of publication; however, accuracy cannot be guaranteed. Market conditions may change and Bristol Gate Capital Partners Inc. accepts no responsibility for individual investment decisions arising from the use of or reliance on the information contained herein. We strongly recommend you consult with a financial advisor prior to making any investment decisions. Please refer to the Legal section of Bristol Gate’s website for additional information at bristolgate.com.
A Note About Forward-Looking Statements
This report may contain forward-looking statements including, but not limited to, statements about the Bristol Gate strategies, risks, expected performance and condition. Forward-looking statements include statements that are predictive in nature, that depend upon or refer to future events and conditions or include words such as “may”, “could”, “would”, “should”, “expect”, “anticipate”, “intend”, “plan”, “believe”, “estimate” and similar forward-looking expressions or negative versions thereof.
These forward-looking statements are subject to various risks, uncertainties and assumptions about the investment strategies, capital markets and economic factors, which could cause actual financial performance and expectations to differ materially from the anticipated performance or other expectations expressed. Economic factors include, but are not limited to, general economic, political and market factors in North America and internationally, interest and foreign exchange rates, global equity and capital markets, business competition, technological change, changes in government regulations, unexpected judicial or regulatory proceedings, and catastrophic events.
Readers are cautioned not to place undue reliance on forward-looking statements and consider the above-mentioned factors and other factors carefully before making any investment decisions. All opinions contained in forward-looking statements are subject to change without notice and are provided in good faith. Forward-looking statements are not guarantees of future performance, and actual results could differ materially from those expressed or implied in any forward-looking statements. Bristol Gate Capital Partners Inc. has no specific intention of updating any forward-looking statements whether as a result of new information, future events or otherwise, except as required by securities legislation.
 Takes 2 minutes